Experian ESG Presentation Deck
Executive Summary
Improving Financial Health
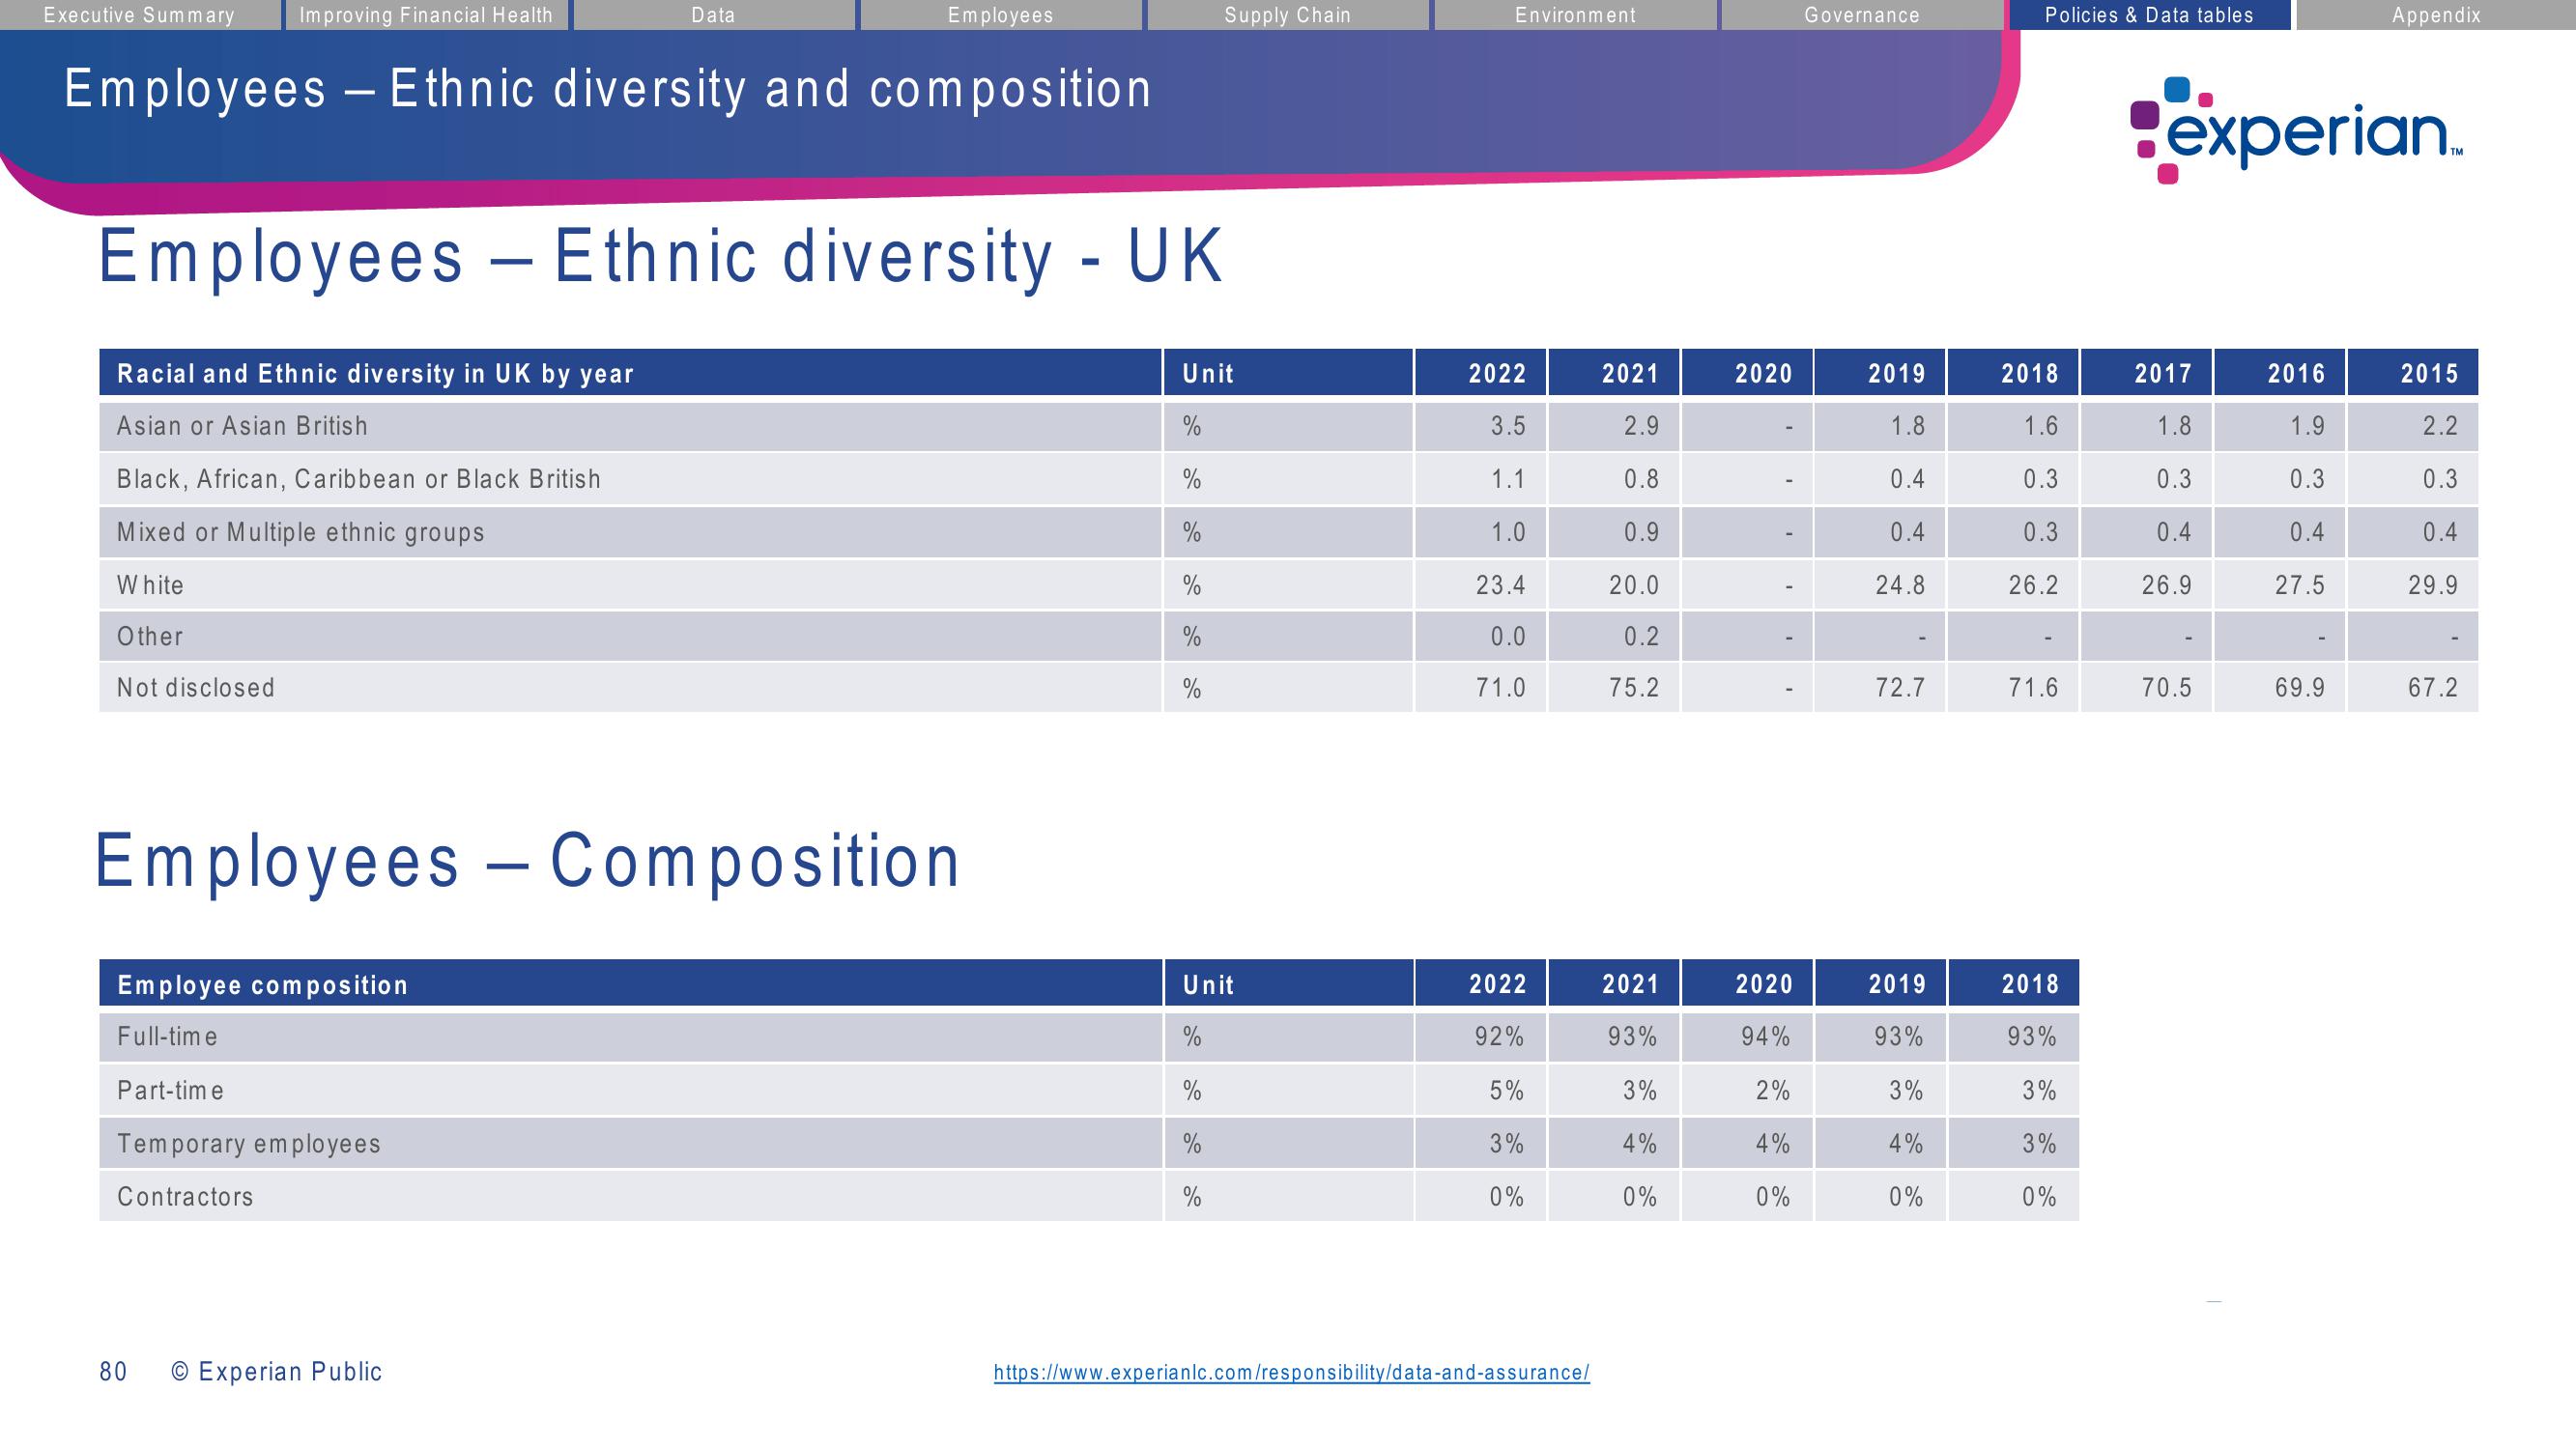
Employees - Ethnic diversity and composition
Racial and Ethnic diversity in UK by year
Asian or Asian British
Black, African, Caribbean or Black British
Mixed or Multiple ethnic groups
White
Other
Not disclosed
Employees - Ethnic diversity - UK
Employee composition
Full-time
Part-time
Temporary employees
Contractors
80
Data
Employees Composition.
Employees
O Experian Public
-
Unit
%
%
%
%
Supply Chain
Unit
%
%
Environment
2022
3.5
1.1
1.0
23.4
0.0
71.0
2022
92%
5%
3%
0%
https://www.experianlc.com/responsibility/data-and-assurance/
2021
2.9
0.8
0.9
20.0
0.2
75.2
2021
93%
3%
4%
0%
2020
2020
94%
2%
4%
0%
Governance
2019
1.8
0.4
0.4
24.8
72.7
2019
93%
3%
4%
0%
Policies & Data tables
2018
1.6
0.3
0.3
26.2
71.6
2018
93%
3%
3%
0%
experian.
2017
1.8
0.3
0.4
26.9
70.5
2016
1.9
0.3
0.4
27.5
Appendix
69.9
2015
2.2
0.3
0.4
29.9
67.2View entire presentation