Inovalon Results Presentation Deck
Q1 2017 Financial Highlights
Growth
Operating
Leverage
Continued
Investment
110
105
95
90
70%
65%
55%
50%
8%
7%
5%
59.2%
Gross Margin
1Q16
102.7
6.4%
1Q16
1016
Revenue ($M)
Sales & Marketing
+6% YOY as reported
Bat YoY organically
64.7%
1017
7.0%
1017
20%
15%
10%
5%
108.3
1017
18.1%
Adj. EBITDA Margin
23.0%
1016
11.3%
52M expected in 02
Outperformance
5.5%
$103.2M, midpoint of
guidance range
Investment in Innovation
16.3%
5.8%
1017
7.2%
#
1Q16
Research and development
Capitalized software development and
Research and development infrastructure investment
1017
inovalon
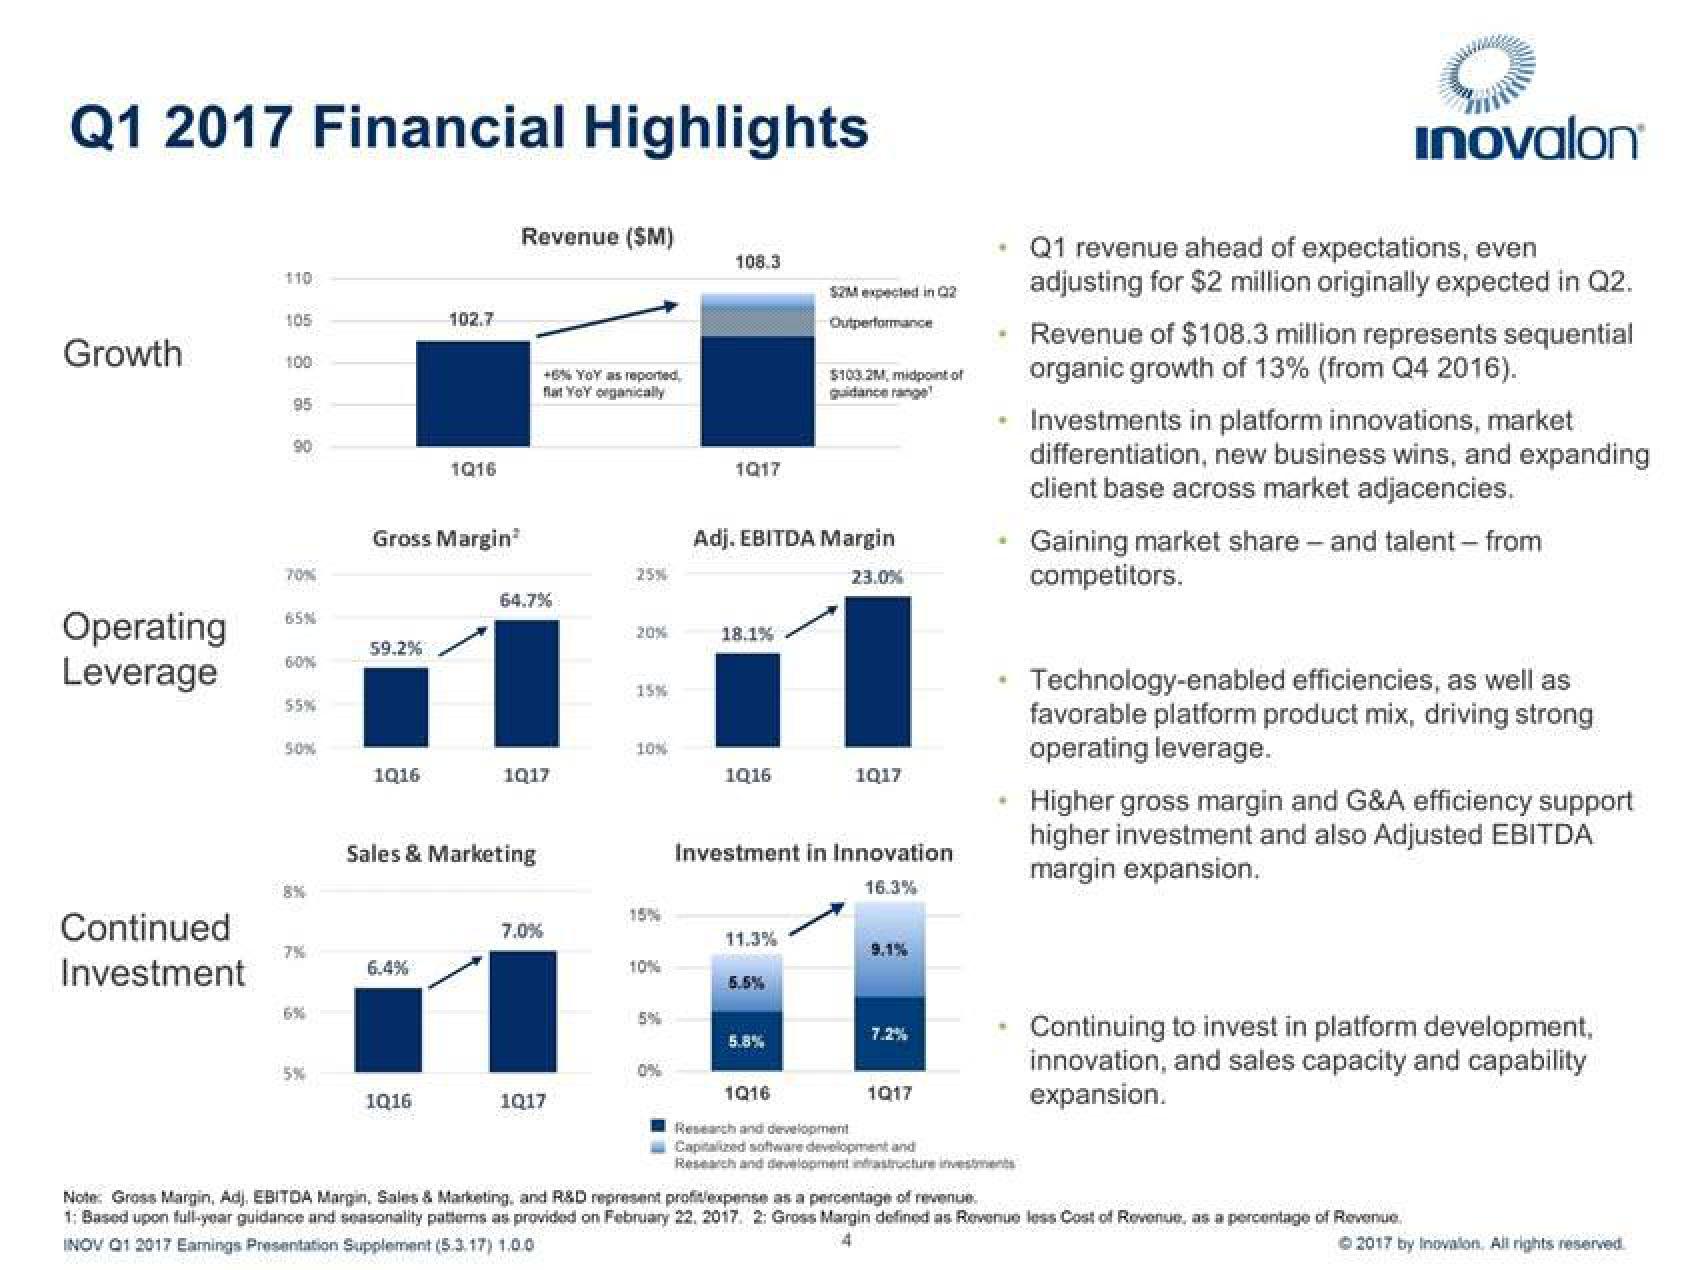
Q1 revenue ahead of expectations, even
adjusting for $2 million originally expected in Q2.
Revenue of $108.3 million represents sequential
organic growth of 13% (from Q4 2016).
Investments in platform innovations, market
differentiation, new business wins, and expanding
client base across market adjacencies.
Gaining market share - and talent - from
competitors.
Technology-enabled efficiencies, as well as
favorable platform product mix, driving strong
operating leverage.
Higher gross margin and G&A efficiency support
higher investment and also Adjusted EBITDA
margin expansion.
Continuing to invest in platform development,
innovation, and sales capacity and capability
expansion.
Note: Gross Margin, Adj. EBITDA Margin, Sales & Marketing, and R&D represent profilexpense as a percentage of revenue.
1: Based upon full-year guidance and seasonality patterns as provided on February 22, 2017, 2: Gross Margin defined as Revenue less Cost of Revenue, as a percentage of Revenue.
INOV 01 2017 Earnings Presentation Supplement (5.3.17) 1.0.0
4
© 2017 by Inovalon. All rights reservedView entire presentation