Deutsche Bank Results Presentation Deck
Q3 2023 highlights
In € bn, unless stated otherwise
Financial results
Statement of income
Revenues
Revenues ex-specific items¹
Provision for credit losses
Noninterest expenses
Adjusted costs
Pre-provision profit
Profit (loss) before tax
Profit (loss)
Balance sheet and resources
Average interest earning assets
Loans²
Deposits
Sustainable Finance volumes (cumulative)³
Risk-weighted assets
Leverage exposure
Performance measures and ratios
ROTE
Cost/income ratio
Provision for credit losses, bps of avg. loans4
CET1 ratio
Leverage ratio
Per share information
Diluted earnings per share
TBV per basic share outstanding
Notes: for footnotes refer to slides 44 and 45
Deutsche Bank
Investor Relations
Q3 2023
7.1
7.1
0.2
5.2
5.0
2.0
1.7
1.2
964
485
611
265
354
1,235
7.3%
72.4%
20
13.9%
4.7%
€ 0.56
€ 27.74
A vs.
Q3 2022
3%
6%
(30)%
4%
2%
0%
7%
(3)%
(3)%
(4)%
(3)%
35%
(4)%
(6)%
(0.9)ppt
0.8 ppt
(8)bps
62 bps
36 bps
(2)%
5%
Q3 2023 results
October 25, 2023
A vs.
Q2 2023
(4)%
(5)%
(39)%
(8)%
0%
9%
23%
28%
1%
0%
3%
4%
(1)%
(0)%
1.9 ppt
(3.2)ppt
(13)bps
19 bps
1 bps
192%
3%
Divisional revenues
Corporate 1.6
Bank
Investment
Bank
Private
Bank
Asset
Management
6.9
C&O
2.4
2.3
0.7
-0.1
Q3 2022
+3%
7.1
1.9
2.3
2.3
0.6
-0.0-
Q3 2023
A vs.
Q3 2022
+21%
(4)%
+3%
(10)%
Key highlights
/
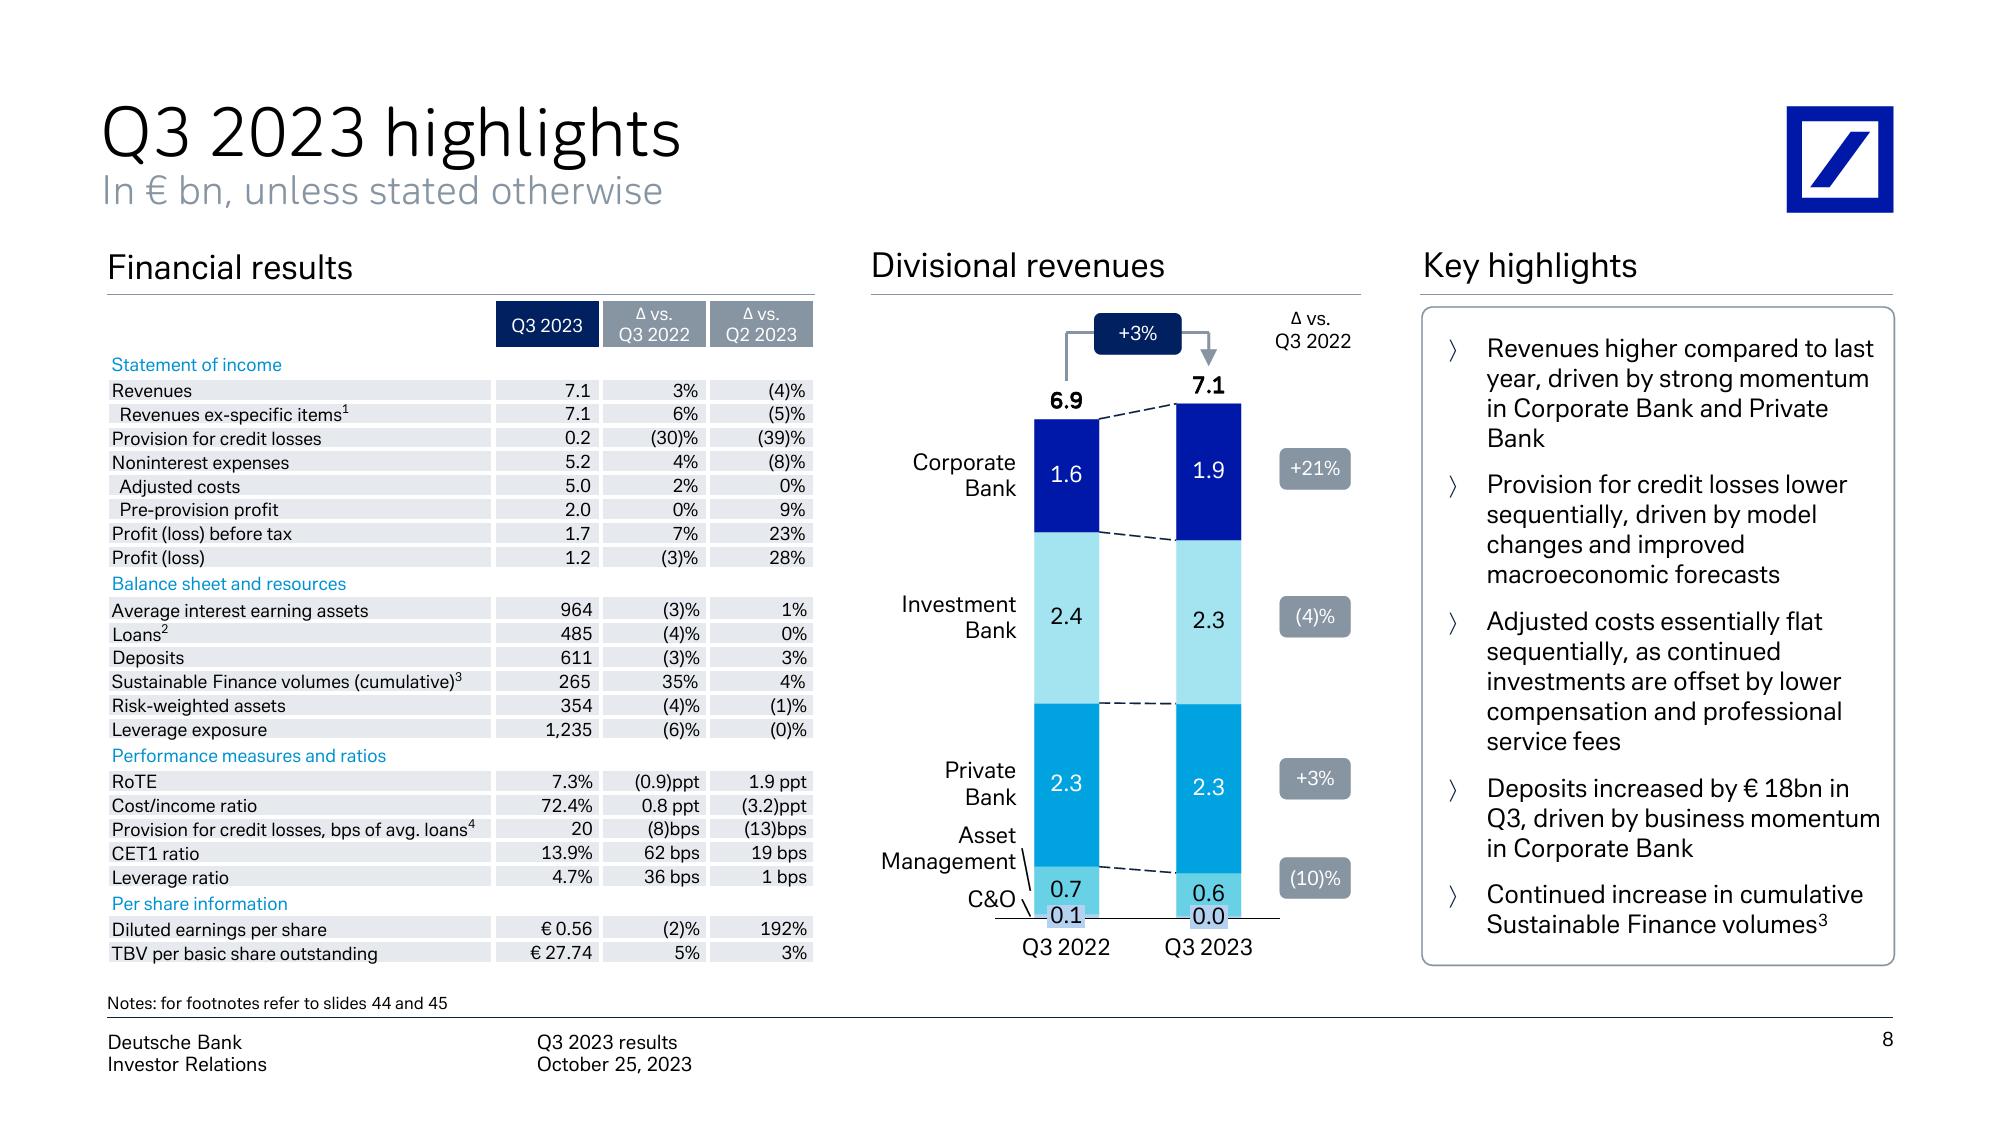
Revenues higher compared to last
year, driven by strong momentum
in Corporate Bank and Private
Bank
Provision for credit losses lower
sequentially, driven by model
changes and improved
macroeconomic forecasts
> Adjusted costs essentially flat
sequentially, as continued
investments are offset by lower
compensation and professional
service fees
> Deposits increased by € 18bn in
Q3, driven by business momentum
in Corporate Bank
> Continued increase in cumulative
Sustainable Finance volumes3
8View entire presentation