Evercore Investment Banking Pitch Book
Preliminary Financial Analysis
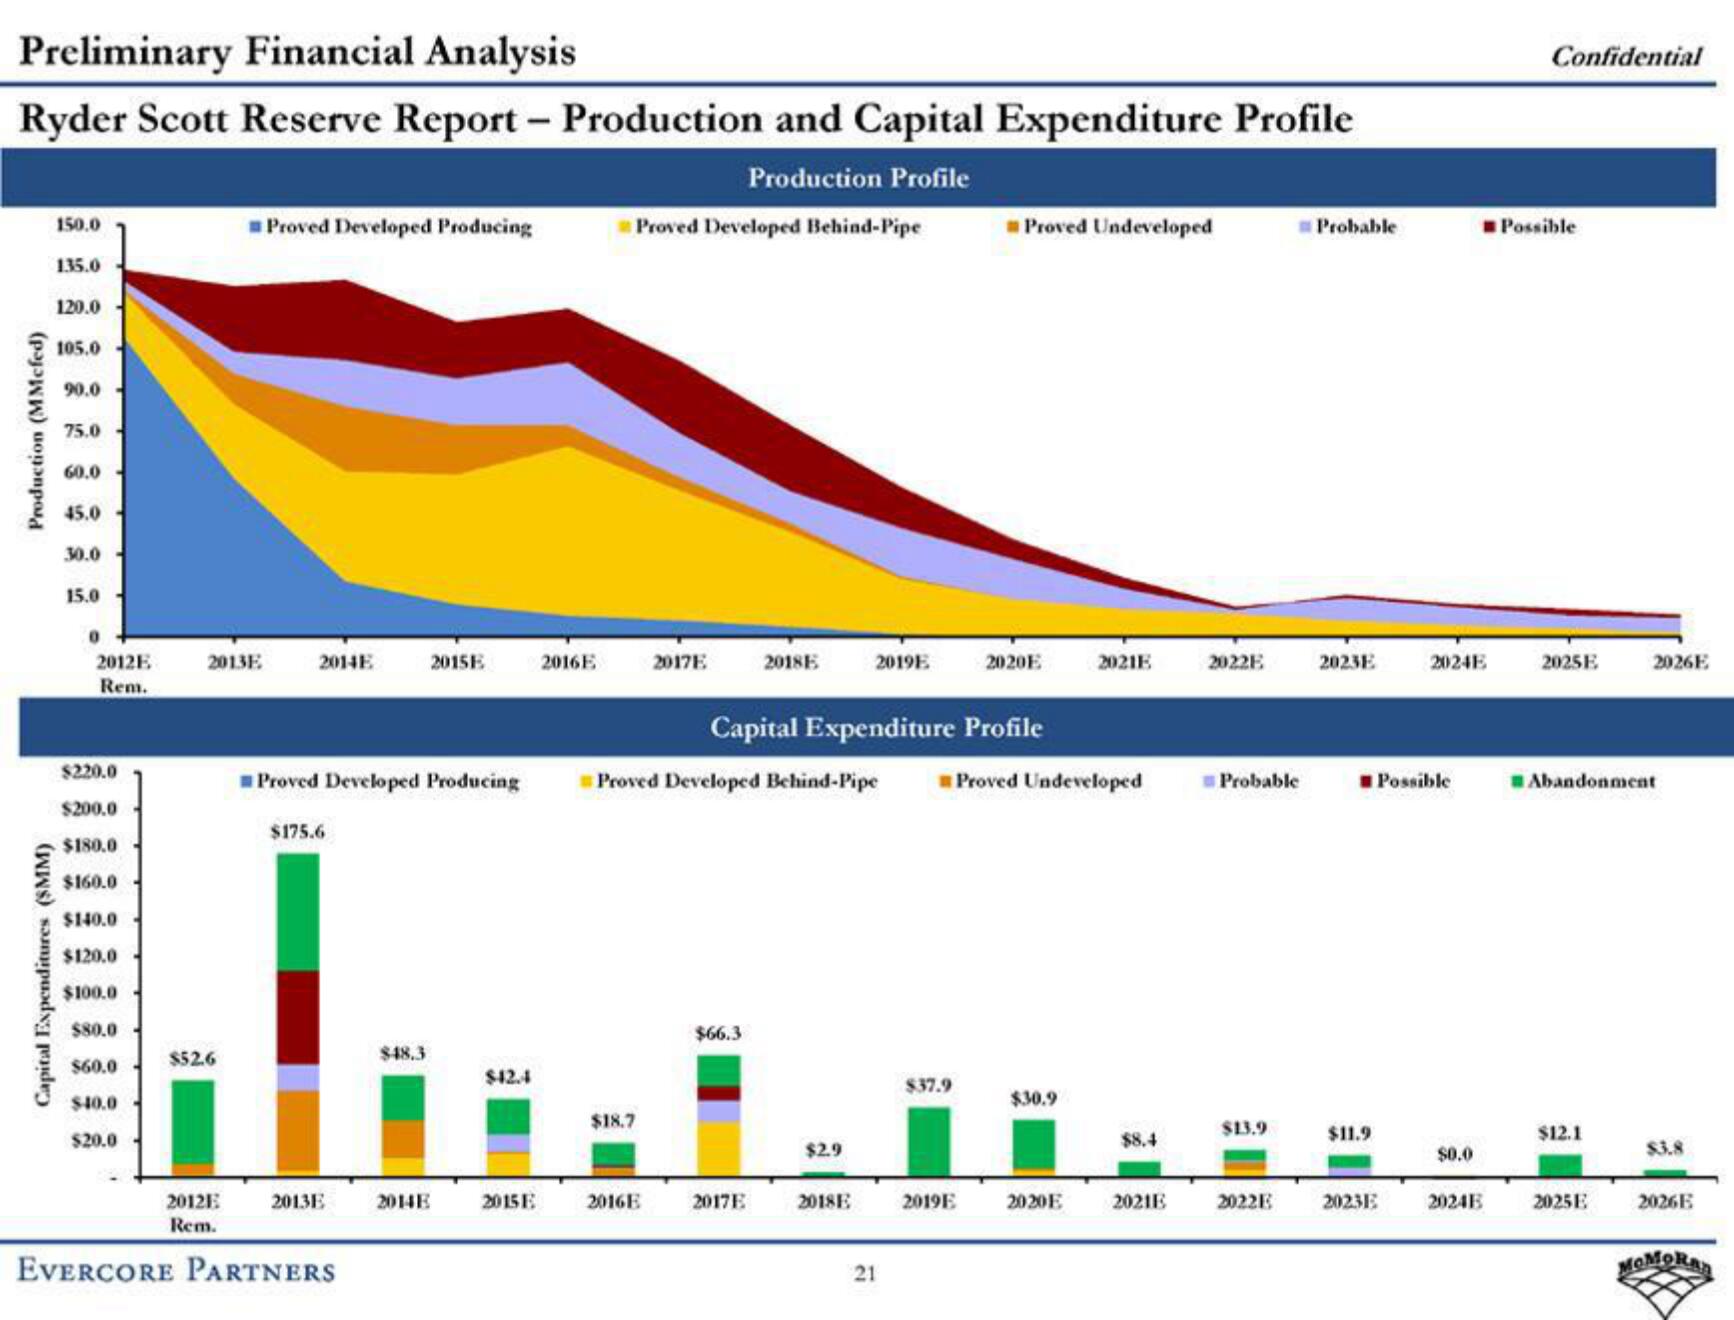
Ryder Scott Reserve Report - Production and Capital Expenditure Profile
Production Profile
Production (MMcfed)
Capital Expenditures (SMM)
150.0
135.0
120.0
105.0
90.0-
75.0-
60.0
45.0-
30.0-
15.0
0
2012E
Rem.
$220.0
$200.0
$180.0
$160.0
$140.0
$120.0
$100.0
$80.0
$60.0
$40.0
$20.0
2013E
$52.6
Proved Developed Producing
2014E
Proved Developed Producing
$175.6
$48.3
2012E 2013E 2014E
Rem.
EVERCORE PARTNERS
2015E
$42.4
2015E
2016E
Proved Developed Behind-Pipe
$18.7
2017E
2016E
Proved Developed Behind-Pipe
2018E
$66.3
2017E
Capital Expenditure Profile
2019E
$2.9
2018E
21
$37.9
Proved Undeveloped
2020E
2019E
Proved Undeveloped
$30.9
2021E
2020E
$8.4
2021E
2022E
Probable
$13.9
2022E
Probable
2023E
$11.9
20231
2024E
Possible
$0.0
20241
Confidential
Possible
2025E
Abandonment
$12.1
2026E
2025E
$3.8
2026E
MOMORView entire presentation