Tradeweb Results Presentation Deck
Asset
Class
Rates
Total
Credit
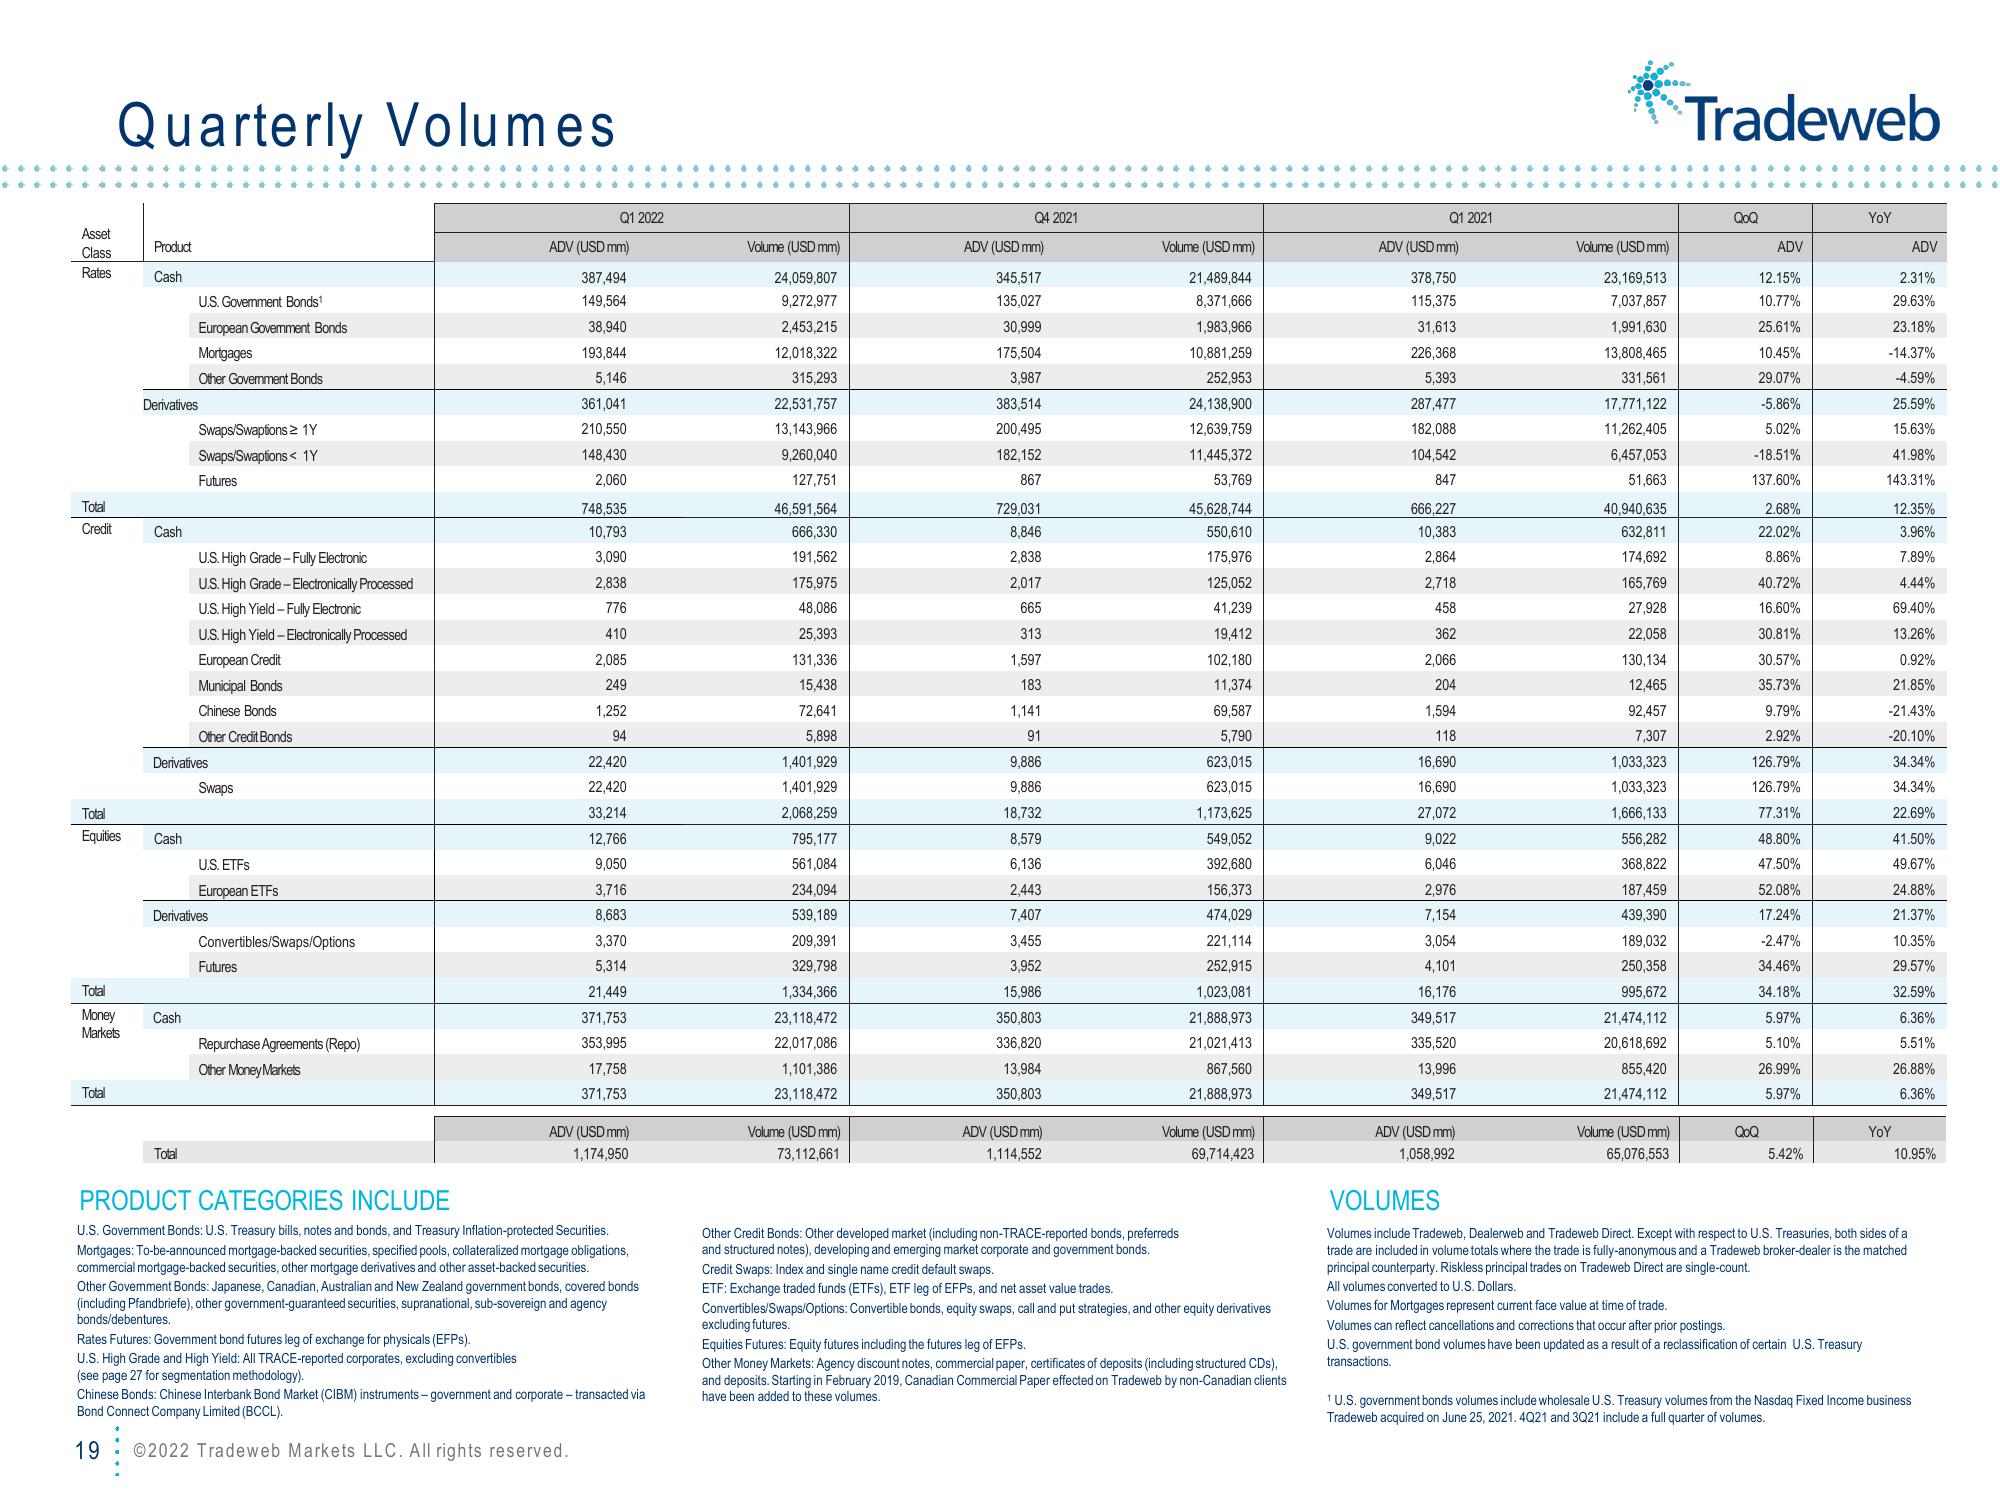
Quarterly Volumes
Total
Equities
Total
Money
Markets
Total
Product
Cash
Derivatives
Cash
Cash
U.S. Government Bonds¹
European Goverment Bonds
Mortgages
Other Goverment Bonds
Cash
Swaps/Swaptions> 1Y
Swaps/Swaptions 1Y
Derivatives
Total
Futures
U.S. High Grade - Fully Electronic
U.S. High Grade - Electronically Processed
U.S. High Yield-Fully Electronic
U.S. High Yield - Electronically Processed
European Credit
Municipal Bonds
Chinese Bonds
Other Credit Bonds
Swaps
Derivatives
U.S. ETFS
European ETFS
Convertibles/Swaps/Options
Futures
Repurchase Agreements (Repo)
Other Money Markets
Q1 2022
ADV (USD mm)
387,494
149,564
38,940
193,844
5,146
361,041
210,550
148,430
2,060
748,535
10,793
3,090
2,838
776
410
2,085
249
1,252
94
22,420
22,420
33,214
12,766
9,050
3,716
8,683
3,370
5,314
21,449
371,753
353,995
17,758
371,753
ADV (USD mm)
1,174,950
PRODUCT CATEGORIES INCLUDE
U.S. Government Bonds: U.S. Treasury bills, notes and bonds, and Treasury Inflation-protected Securities.
Mortgages: To-be-announced mortgage-backed securities, specified pools, collateralized mortgage obligations,
commercial mortgage-backed securities, other mortgage derivatives and other asset-backed securities.
Other vemment Bonds: Japanese, Canadian, Australiana New Zealand government bonds, covered bonds
(including Pfandbriefe), other government-guaranteed securities, supranational, sub-sovereign and agency
bonds/debentures.
Rates Futures: Govemment bond futures leg of exchange for physicals (EFPs).
U.S. High Grade and High Yield: All TRACE-reported corporates, excluding convertibles
(see page 27 for segmentation methodology).
Chinese Bonds: Chinese Interbank Bond Market (CIBM) instruments-government and corporate - transacted via
Bond Connect Company Limited (BCCL).
19 2022 Tradeweb Markets LLC. All rights reserved.
Volume (USD mm)
24,059,807
9,272,977
2,453,215
12,018,322
315,293
22,531,757
13,143,966
9,260,040
127,751
46,591,564
666,330
191,562
175,975
48,086
25,393
131,336
15,438
72,641
5,898
1,401,929
1,401,929
2,068,259
795,177
561,084
234,094
539,189
209,391
329,798
1,334,366
23,118,472
22,017,086
1,101,386
23,118,472
Volume (USD mm)
73,112,661
Q4 2021
ADV (USD mm)
345,517
135,027
30,999
175,504
3,987
383,514
200,495
182,152
867
729,031
8,846
2,838
2,017
665
313
1,597
183
1,141
91
9,886
9,886
18,732
8,579
6,136
2,443
7,407
3,455
3,952
15,986
350,803
336,820
13,984
350,803
ADV (USD mm)
1,114,552
Volume (USD mm)
21,489,844
8,371,666
1,983,966
10,881,259
252,953
24,138,900
12,639,759
11,445,372
53,769
45,628,744
550,610
175,976
125,052
41,239
19,412
102,180
11,374
69,587
5,790
Other Credit Bonds: Other developed market (including non-TRACE-reported bonds, preferreds
and structured notes), developing and emerging market corporate and government bonds.
Credit Swaps: Index and single name credit default swaps.
ETF: Exchange traded funds (ETFs), ETF leg of EFPs, and net asset value trades.
623,015
623,015
1,173,625
549,052
392,680
156,373
474,029
221,114
252,915
1,023,081
21,888,973
21,021,413
867,560
21,888,973
Volume (USD mm)
69,714,423
Convertibles/Swaps/Options: Convertible bonds, equity swaps, call and put strategies, and other equity derivatives
excluding futures.
Equities Futures: Equity futures including the futures leg of EFPs.
Other Money Markets: Agency discount notes, commercial paper, certificates of deposits (including structured CDs),
and deposits. Starting in February 2019, Canadian Commercial Paper effected on Tradeweb by non-Canadian clients
have been added to these volumes.
Q1 2021
ADV (USD mm)
378,750
115,375
31,613
226,368
5,393
287,477
182,088
104,542
847
666,227
10,383
2,864
2,718
458
362
2,066
204
1,594
118
16.690
16,690
27,072
9,022
6,046
2,976
7,154
3,054
4,101
16,176
349,517
335,520
13,996
349,517
ADV (USD mm)
1,058,992
Volume (USD mm)
23,169,513
7,037,857
1,991,630
13,808,465
331,561
17,771,122
11,262,405
6,457,053
51,663
40,940,635
632,811
174,692
165,769
27,928
22,058
130,134
12,465
92,457
7,307
1,033,323
1,033,323
1,666,133
556,282
368,822
187,459
439,390
189,032
250,358
995,672
21,474,112
20,618,692
855,420
21,474,112
Volume (USD mm)
65,076,553
Tradeweb
QoQ
ADV
12.15%
10.77%
25.61%
10.45%
29.07%
-5.86%
5.02%
-18.51%
137.60%
2.68%
22.02%
8.86%
40.72%
16.60%
30.81%
30.57%
35.73%
9.79%
2.92%
126.79%
126.79%
77.31%
48.80%
47.50%
52.08%
17.24%
-2.47%
34.46%
34.18%
5.97%
5.10%
26.99%
5.97%
QoQ
5.42%
YoY
Volumes for Mortgages represent current face value at time of trade.
Volumes can reflect cancellations and corrections that occur after prior postings.
U.S. government bond volumes have been updated as a result of a reclassification of certain U.S. Treasury
transactions.
ADV
2.31%
29.63%
23.18%
-14.37%
-4.59%
25.59%
15.63%
41.98%
143.31%
12.35%
3.96%
7.89%
4.44%
69.40%
13.26%
0.92%
21.85%
-21.43%
-20.10%
34.34%
34.34%
22.69%
41.50%
49.67%
YoY
24.88%
21.37%
10.35%
29.57%
32.59%
6.36%
5.51%
26.88%
6.36%
10.95%
VOLUMES
Volumes include Tradeweb, Dealerweb and Tradeweb Direct. Except with respect to U.S. Treasuries, both sides of a
trade are included in volume totals where the trade is fully-anonymous and a Tradeweb broker-dealer is the matched
principal counterparty. Riskless principal trades on Tradeweb Direct are single-count.
All volumes converted to U.S. Dollars.
¹ U.S. government bonds volumes include wholesale U.S. Treasury volumes from the Nasdaq Fixed Income business
Tradeweb acquired on June 25, 2021. 4Q21 and 3Q21 include a full quarter of volumes.View entire presentation