MoneyLion Results Presentation Deck
Our Record Performance Continues
Scale
Growth
Performance
▪ 3.9M+ Total Customers (1)
▪ 9.0M+ Total Products (3)
$408M Total Originations in Q1 2022 (4)
▪ 755 global employees
▪ 117% Y/Y Total Customers growth in Q1 2022
▪ 116% Y/Y Total Origination growth in Q1 2022
▪ 105% Y/Y Adjusted Revenue growth in Q1 2022
▪ 60%+ Adjusted Gross Profit margins
$74 annualized ARPU
I
▪ < 6 month payback period on customer
acquisition
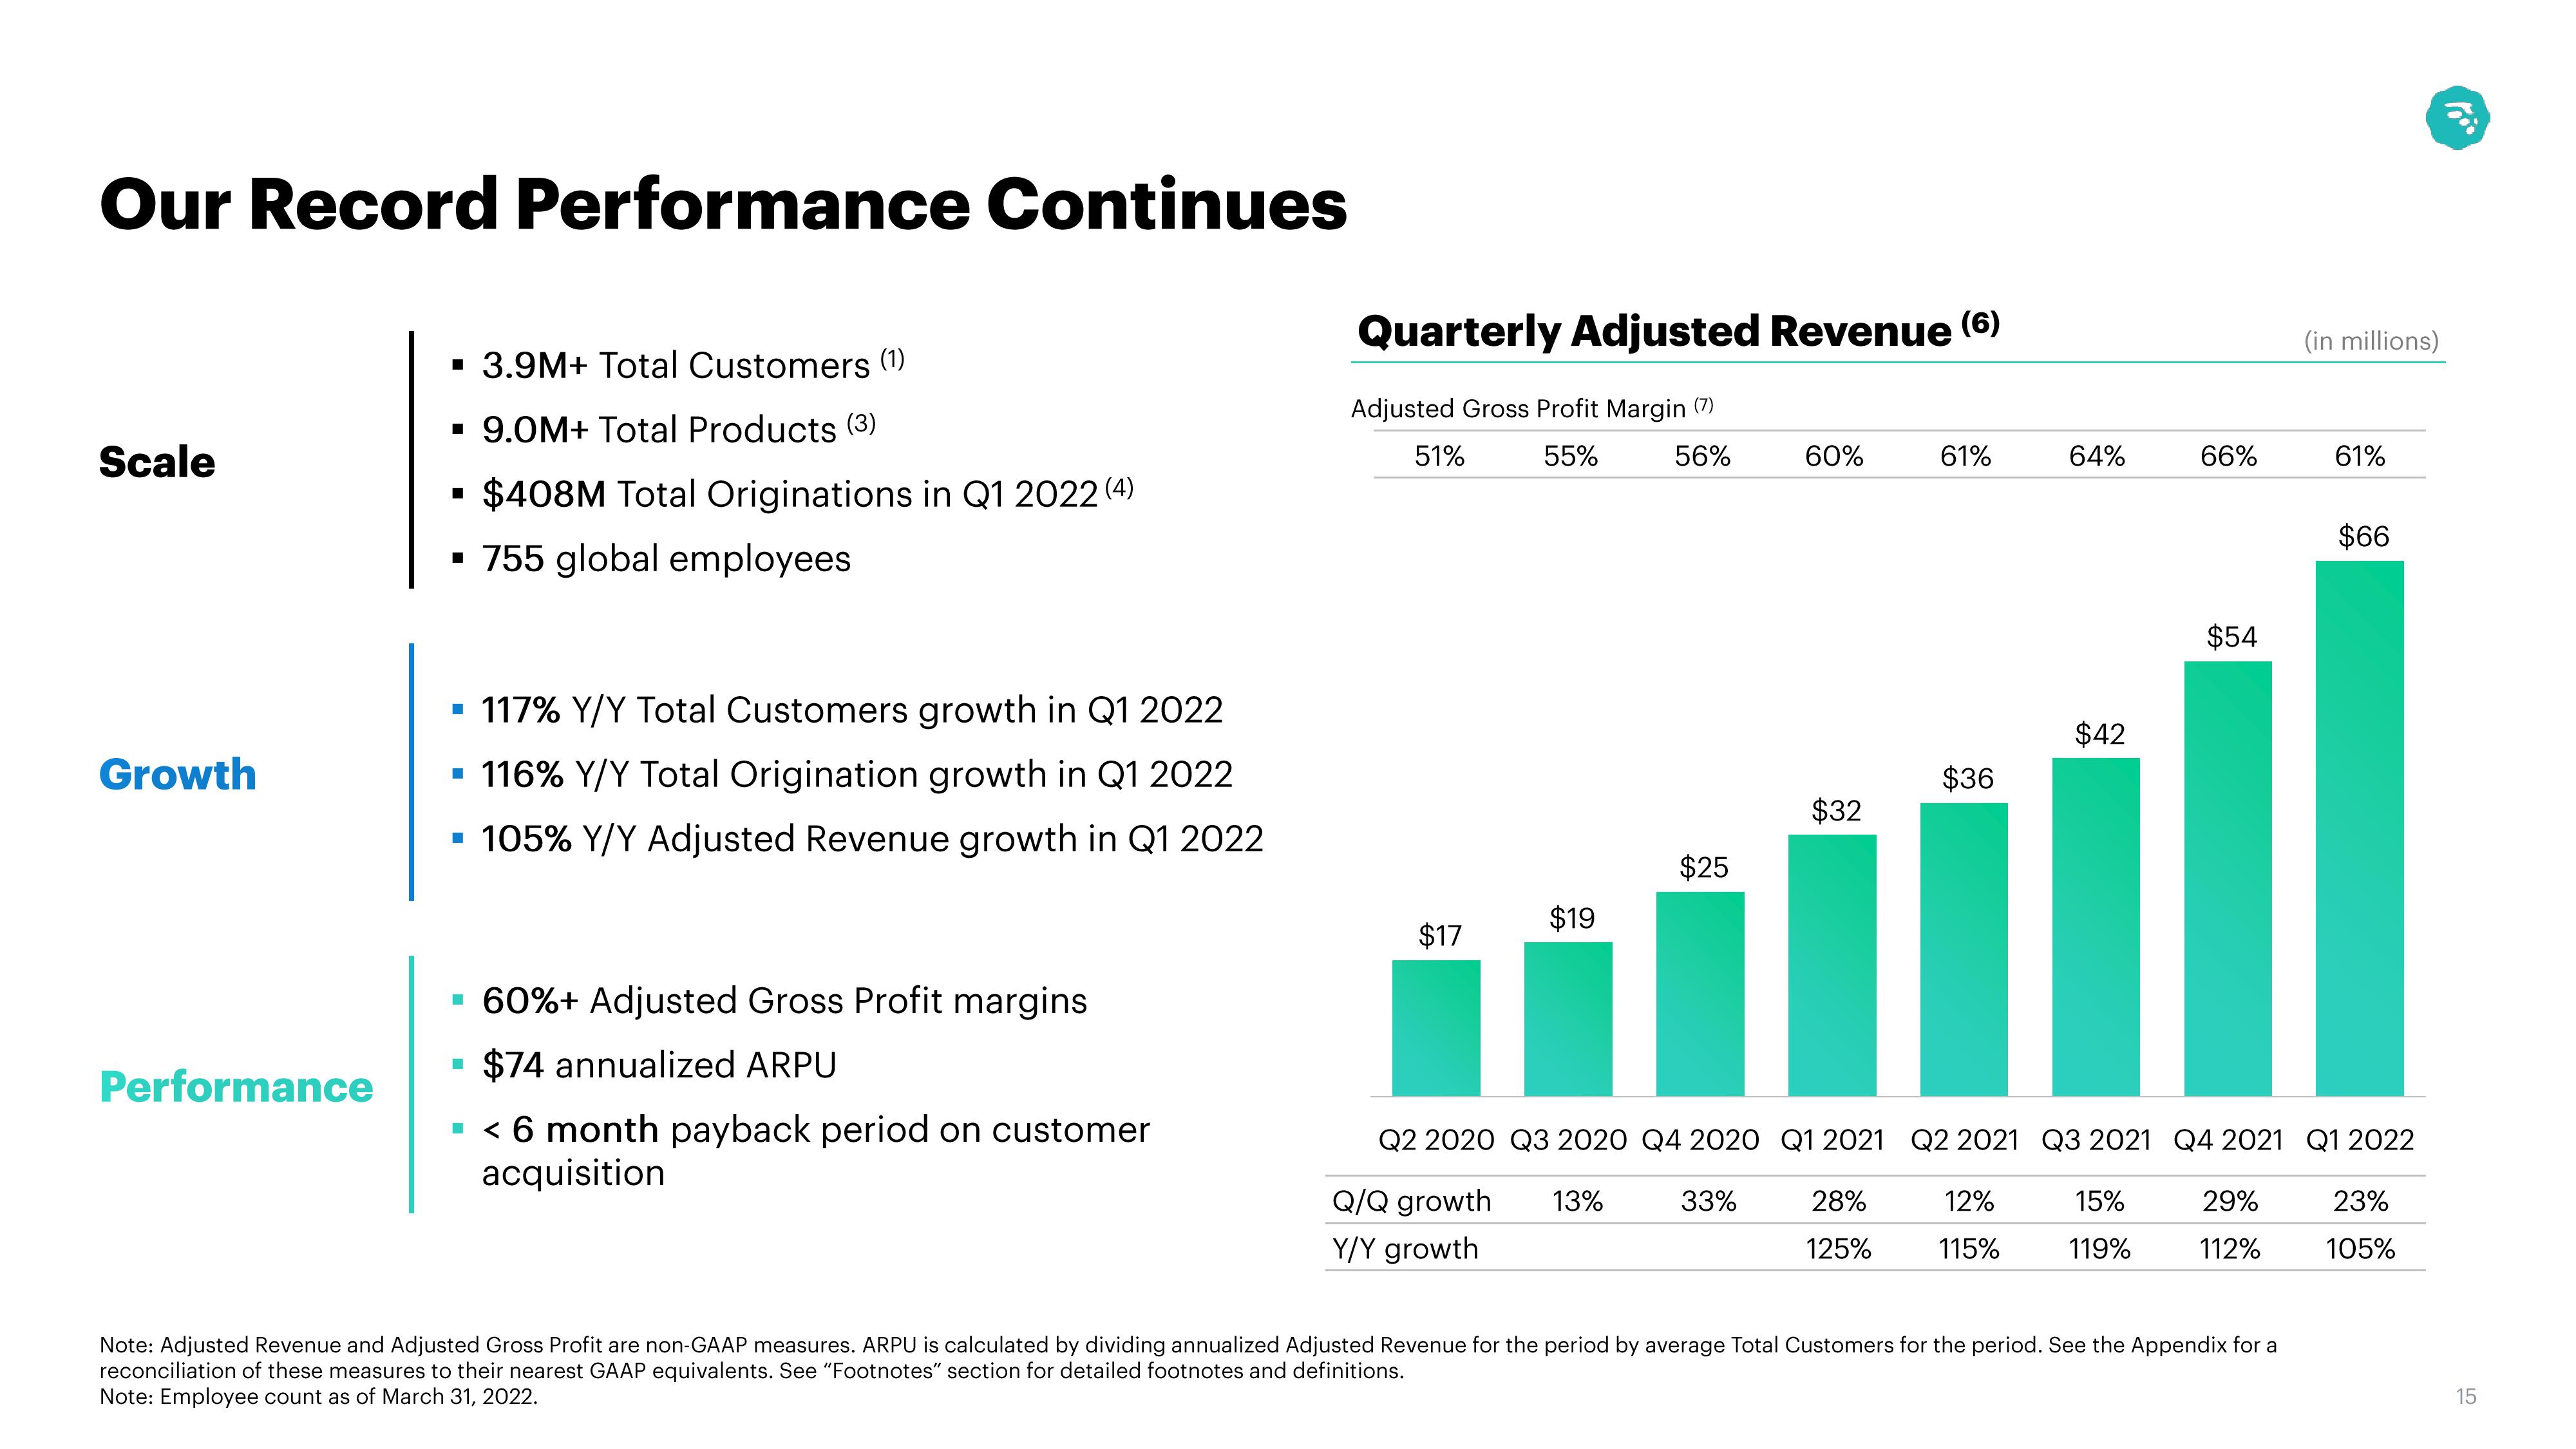
Quarterly Adjusted Revenue (6)
Adjusted Gross Profit Margin (7)
51%
55%
56%
$17
$19
$25
60%
33%
$32
61%
28%
125%
$36
64%
12%
115%
$42
66%
15%
119%
$54
Q2 2020 Q3 2020 Q4 2020 Q1 2021 Q2 2021 Q3 2021 Q4 2021 Q1 2022
Q/Q growth 13%
Y/Y growth
29%
112%
(in millions)
Note: Adjusted Revenue and Adjusted Gross Profit are non-GAAP measures. ARPU is calculated by dividing annualized Adjusted Revenue for the period by average Total Customers for the period. See the Appendix for a
reconciliation of these measures to their nearest GAAP equivalents. See "Footnotes" section for detailed footnotes and definitions.
Note: Employee count as of March 31, 2022.
61%
$66
23%
105%
15View entire presentation