Vivid Seats Investor Presentation Deck
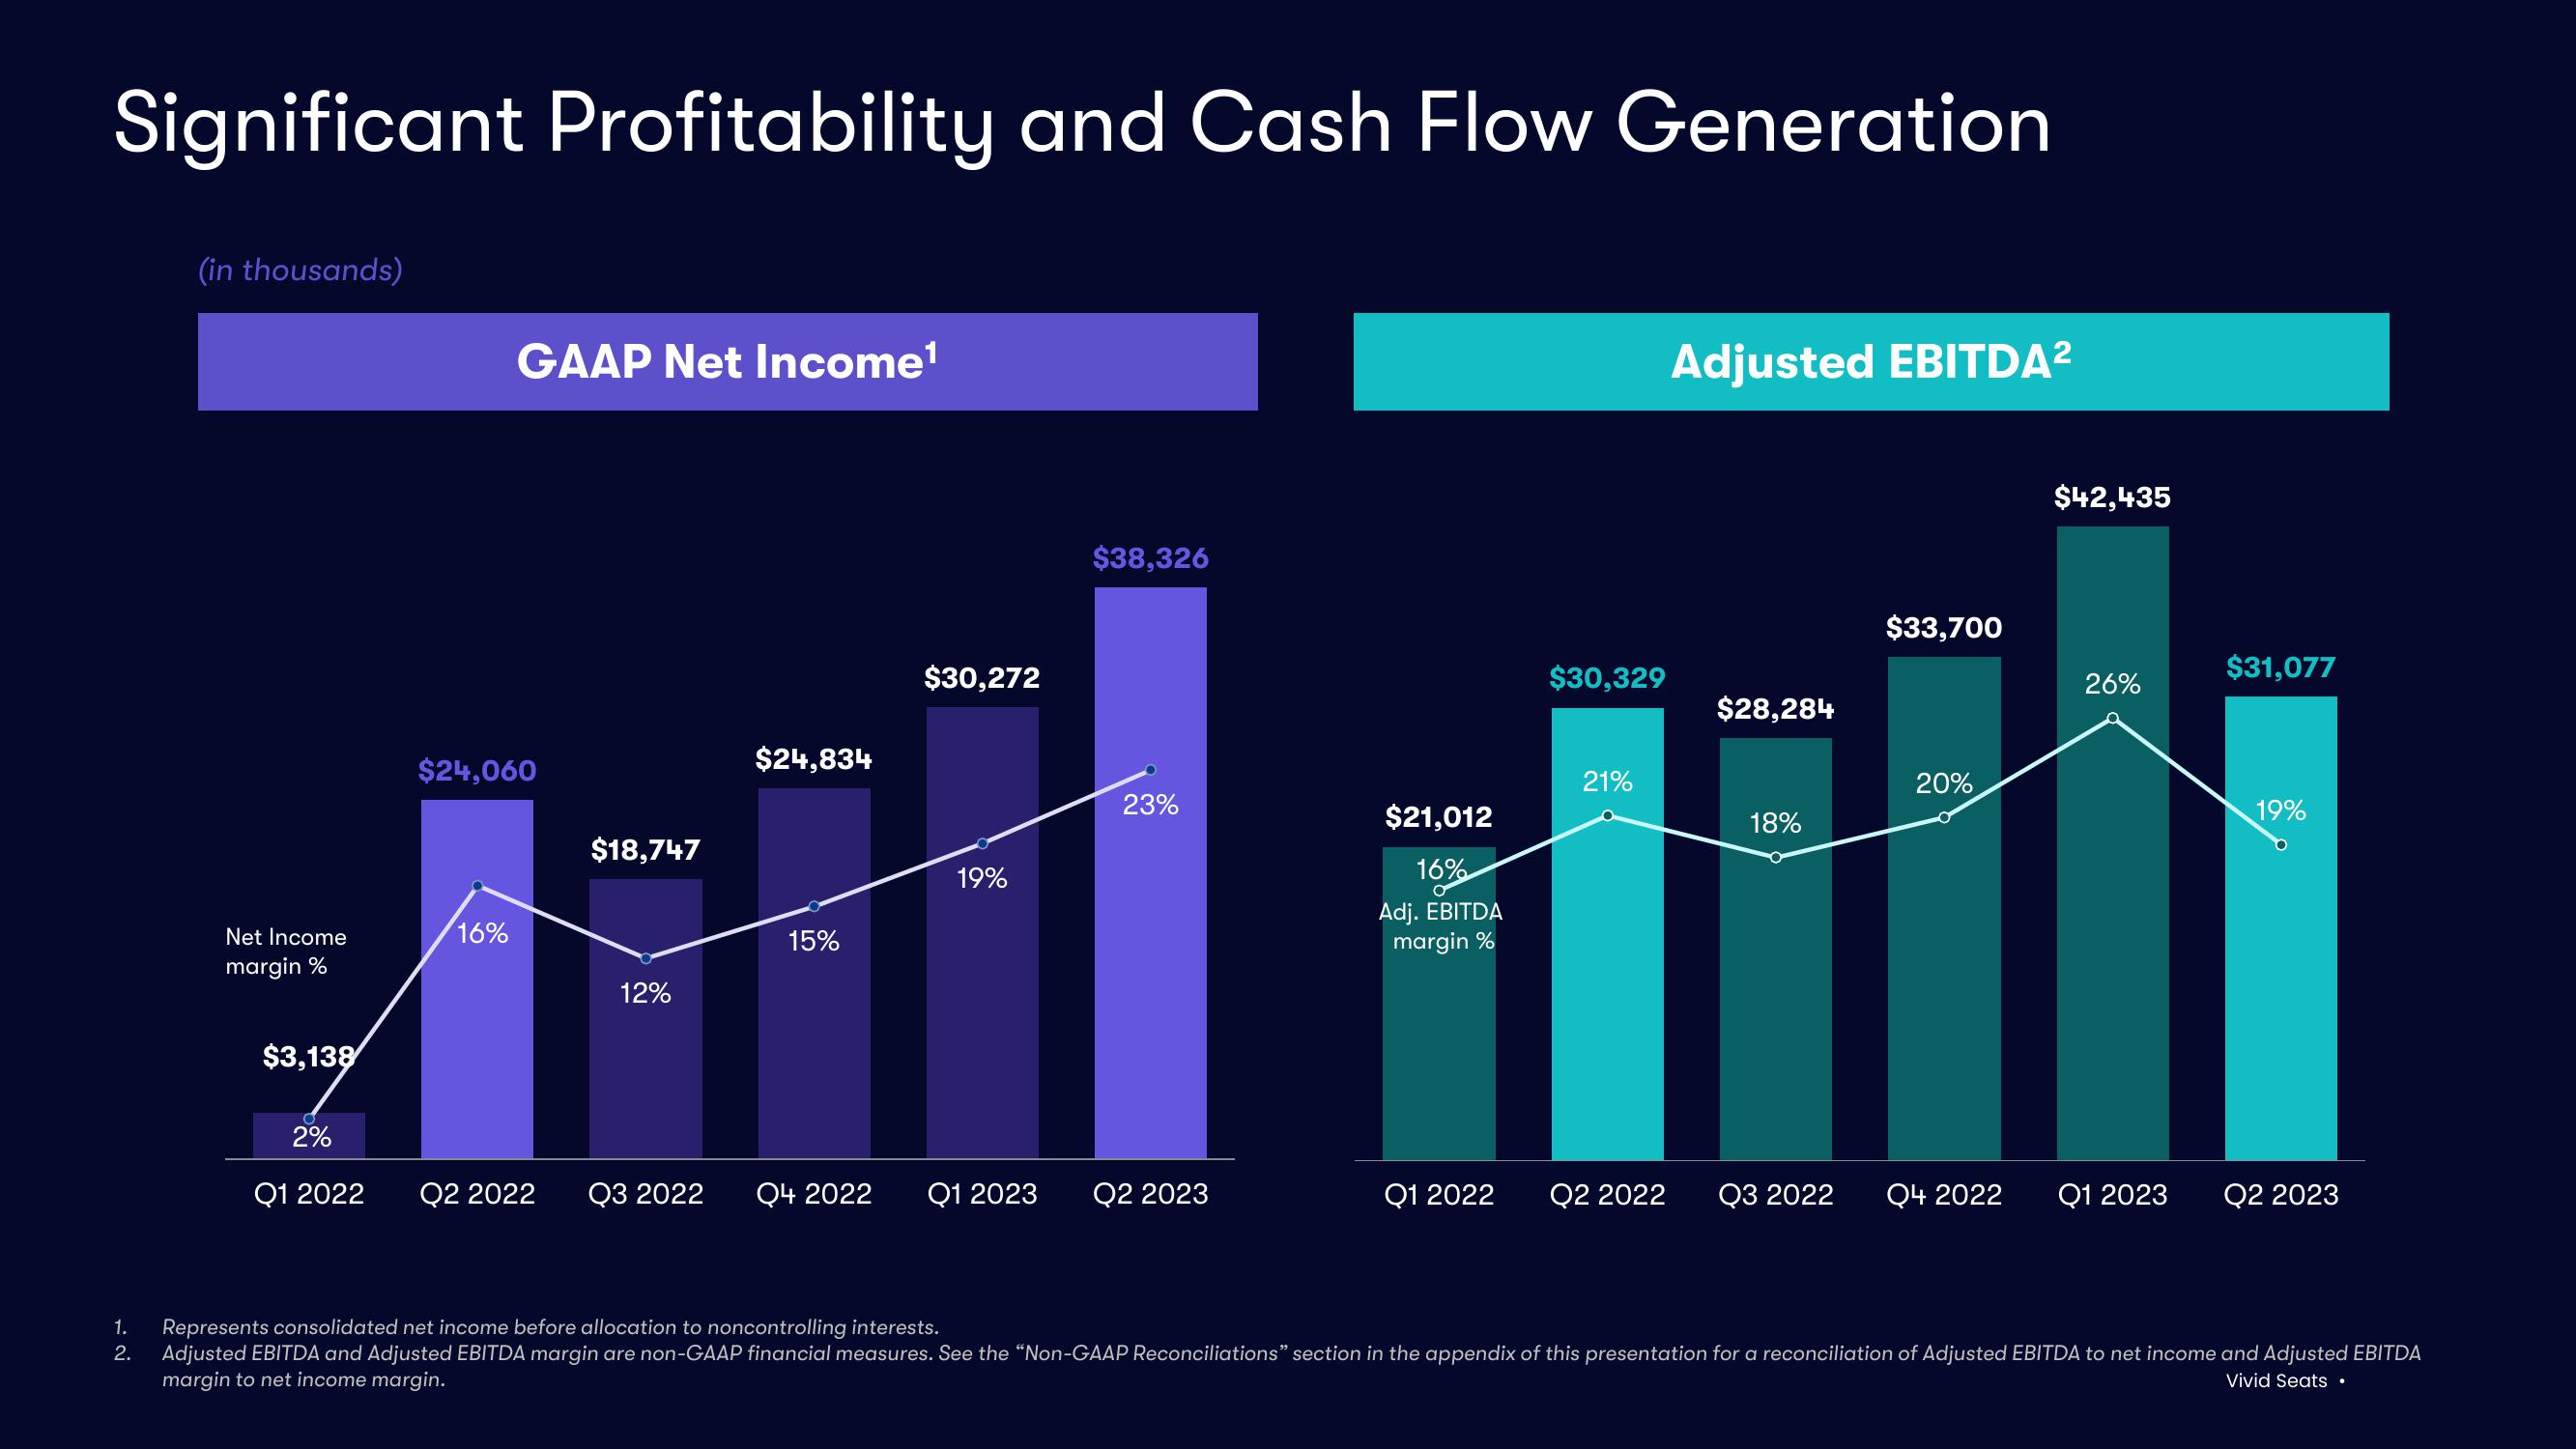
Significant Profitability and Cash Flow Generation
1.
2.
(in thousands)
Net Income
margin %
$3,138
2%
GAAP Net Income¹
$24,060
16%
$18,747
12%
$24,834
15%
$30,272
19%
$38,326
23%
Q1 2022 Q2 2022 Q3 2022 Q4 2022 Q1 2023 Q2 2023
$21,012
16%
Adj. EBITDA
margin %
Q1 2022
$30,329
21%
Q2 2022
Adjusted EBITDA²
$28,284
18%
$33,700
20%
$42,435
26%
Q3 2022 Q4 2022 Q1 2023
$31,077
19%
Q2 2023
Represents consolidated net income before allocation to noncontrolling interests.
Adjusted EBITDA and Adjusted EBITDA margin are non-GAAP financial measures. See the "Non-GAAP Reconciliations" section in the appendix of this presentation for a reconciliation of Adjusted EBITDA to net income and Adjusted EBITDA
margin to net income margin.
Vivid Seats .View entire presentation