Flutter Investor Day Presentation Deck
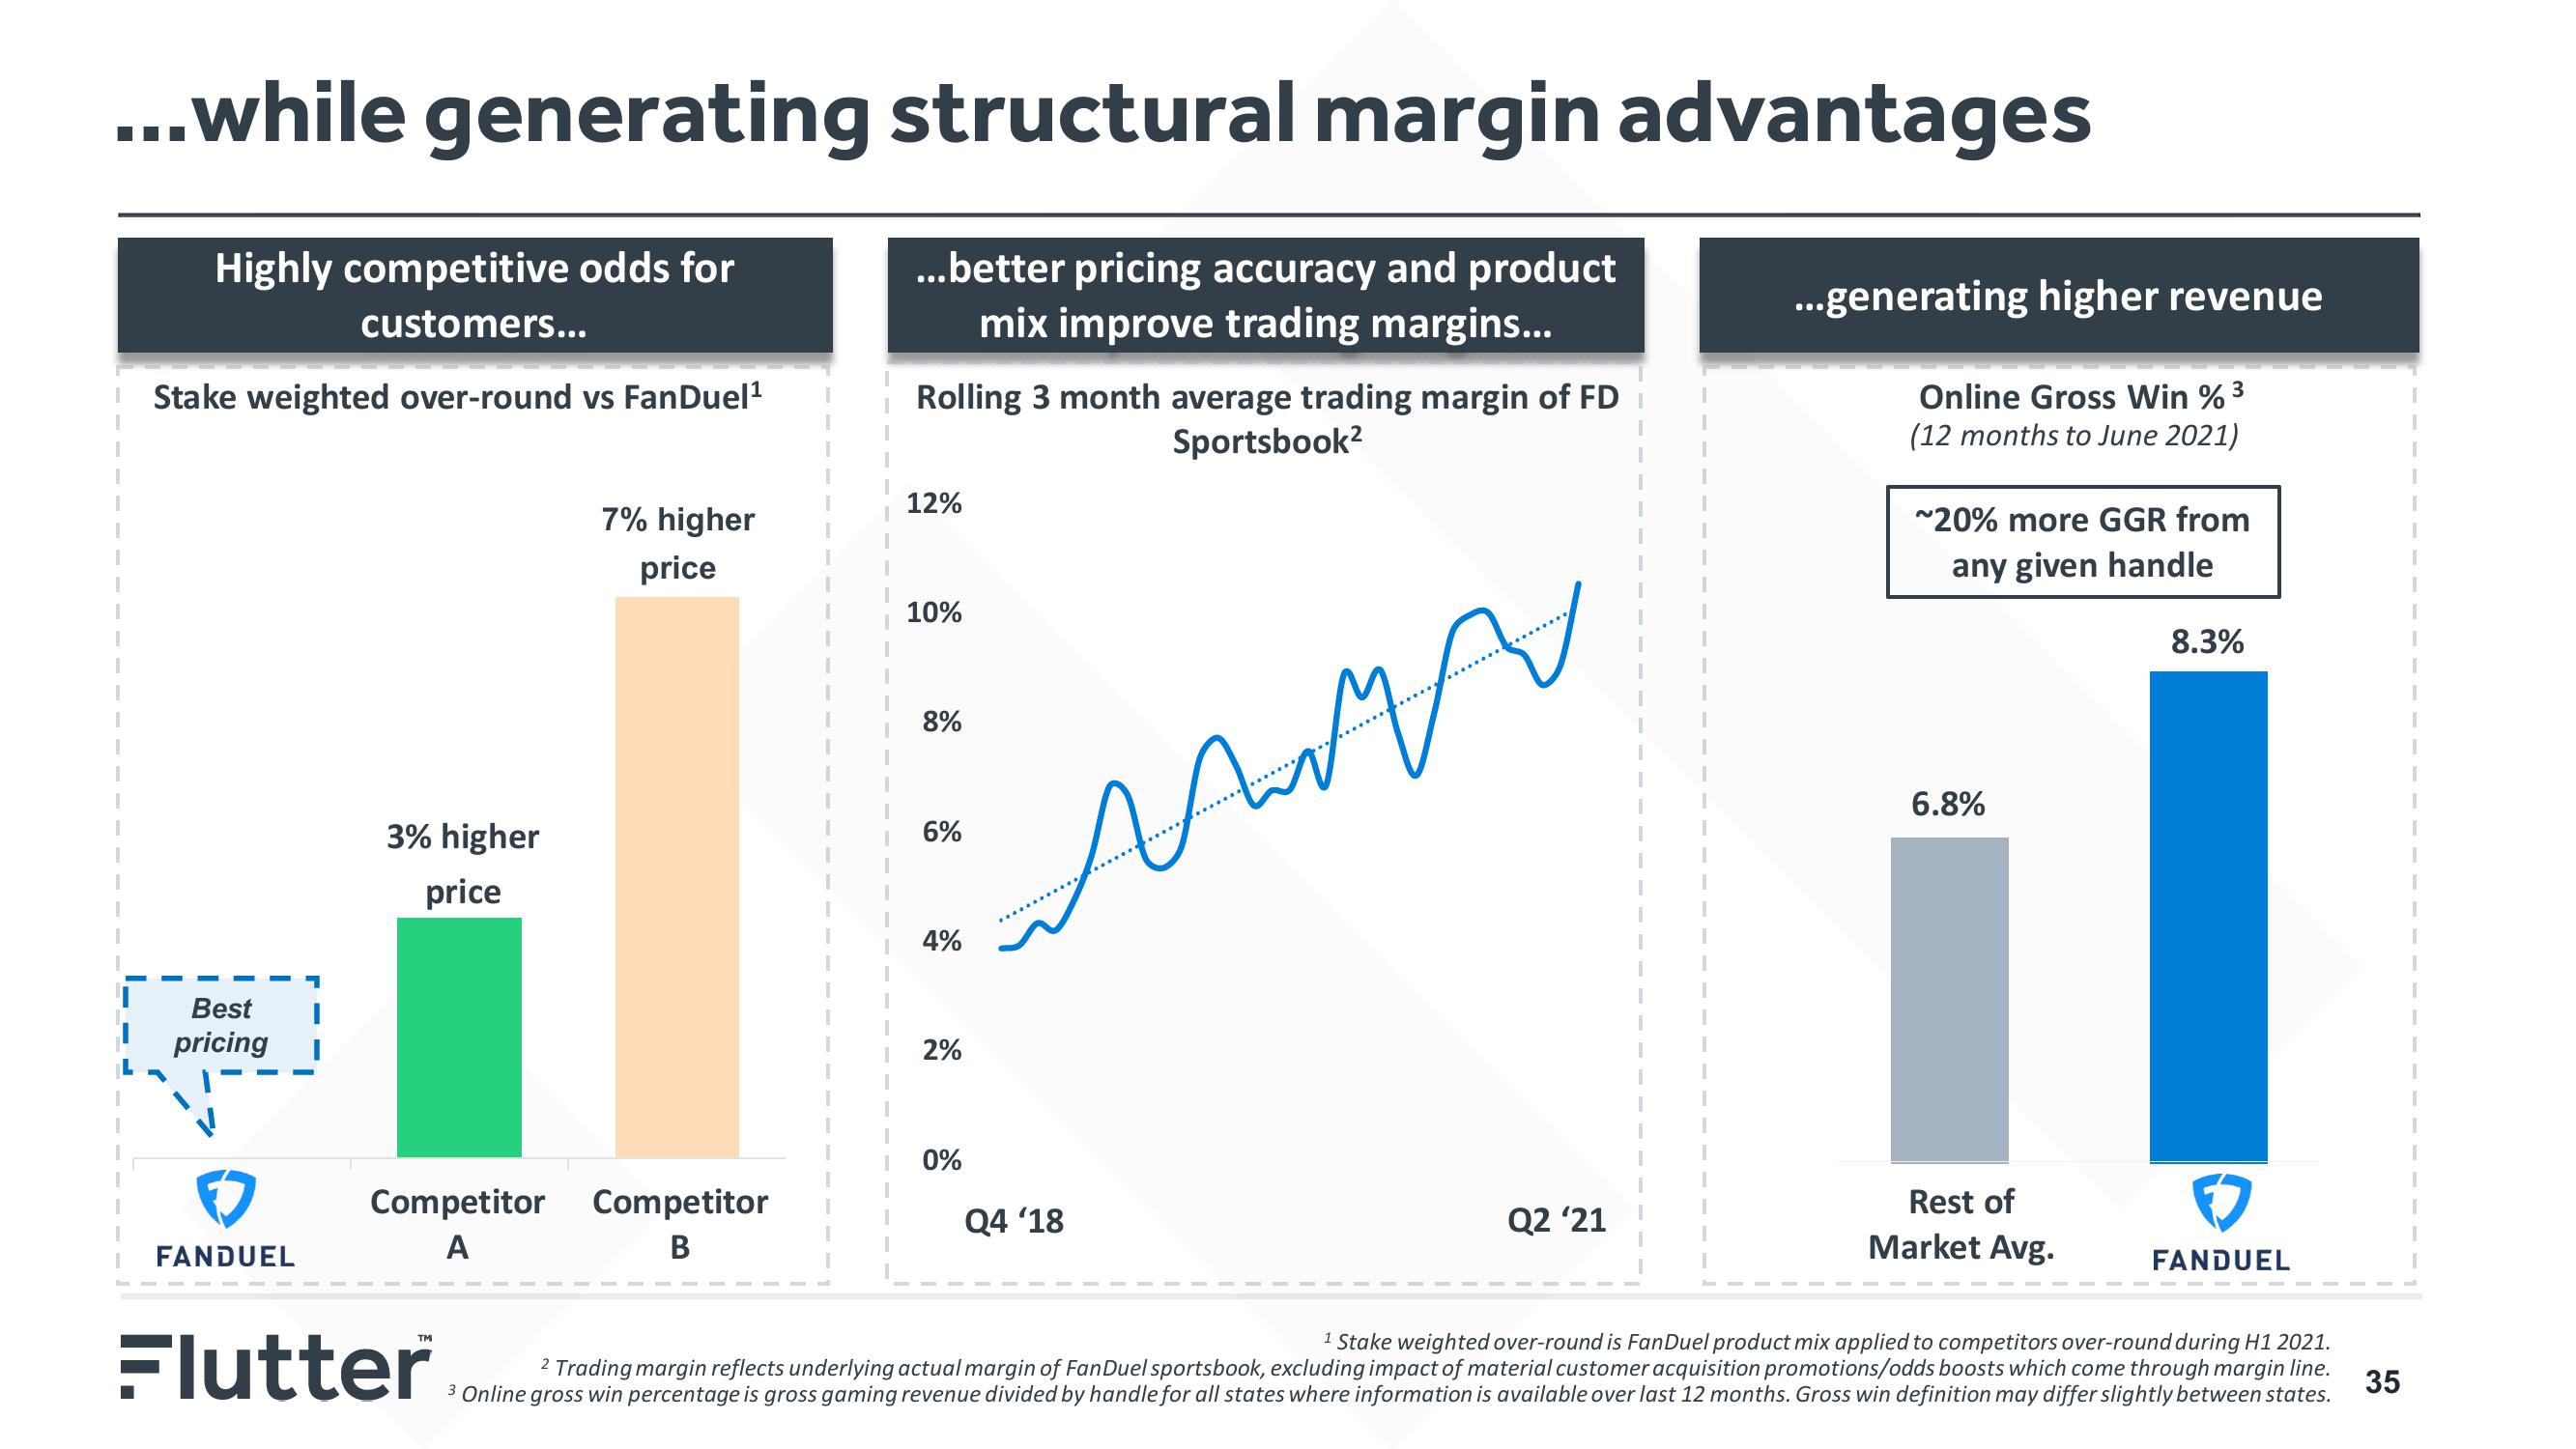
...while generating structural margin advantages
Highly competitive odds for
customers...
...better pricing accuracy and product
mix improve trading margins...
Stake weighted over-round vs FanDuel¹
Best
pricing
FANDUEL
3% higher
price
7% higher
price
Competitor Competitor
A
B
Flutter
Rolling 3 month average trading margin of FD i
Sportsbook²
12%
10%
8%
6%
4%
2%
0%
my
Q4 '18
Q2 '21
...generating higher revenue
Online Gross Win % ³
(12 months to June 2021)
~20% more GGR from
any given handle
6.8%
Rest of
Market Avg.
8.3%
✓
FANDUEL
1 Stake weighted over-round is FanDuel product mix applied to competitors over-round during H1 2021.
Trading margin reflects underlying actual margin of FanDuel sportsbook, excluding impact of material customer acquisition promotions/odds boosts which come through margin line.
3 Online gross win percentage is gross gaming revenue divided by handle for all states where information is available over last 12 months. Gross win definition may differ slightly between states.
35
I
IView entire presentation