J.P.Morgan 4Q23 Earnings Results
JPMORGAN CHASE & CO.
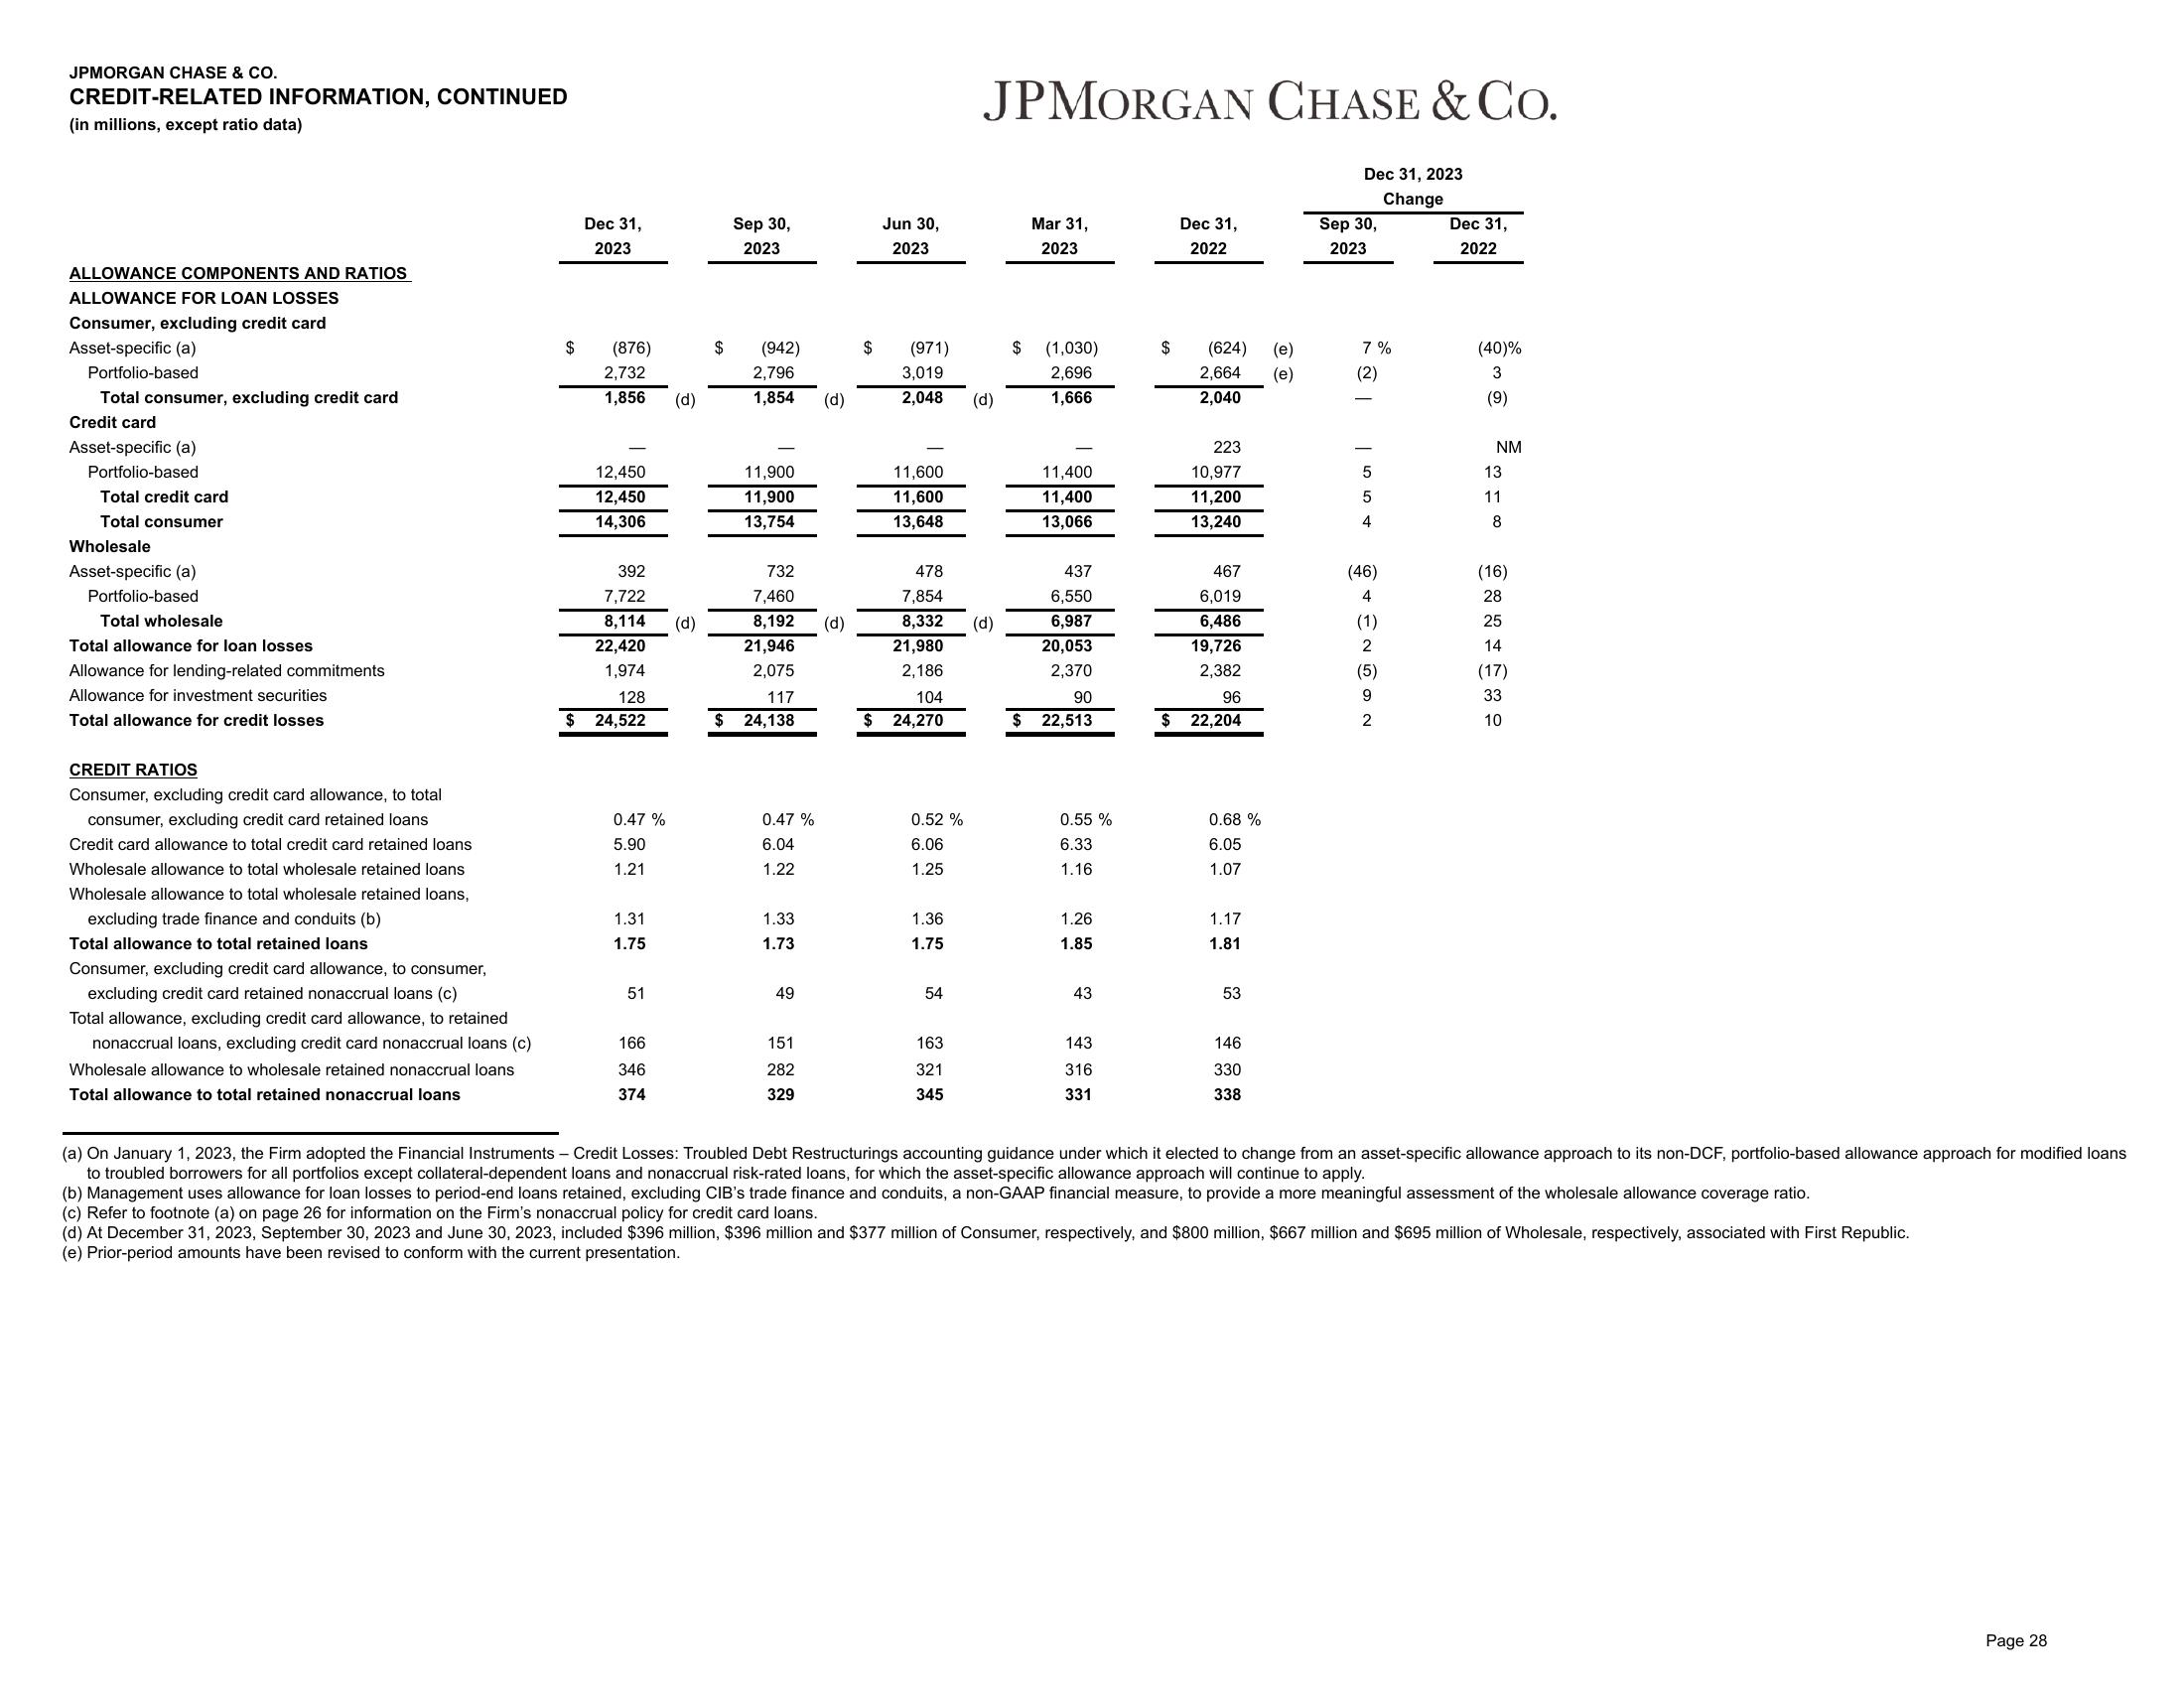
CREDIT-RELATED INFORMATION, CONTINUED
(in millions, except ratio data)
ALLOWANCE COMPONENTS AND RATIOS
ALLOWANCE FOR LOAN LOSSES
Consumer, excluding credit card
Asset-specific (a)
Portfolio-based
Total consumer, excluding credit card
Credit card
Asset-specific (a)
Portfolio-based
Total credit card
Total consumer
Wholesale
Asset-specific (a)
Portfolio-based
Total wholesale
Total allowance for loan losses
Allowance for lending-related commitments
Allowance for investment securities
Total allowance for credit losses
CREDIT RATIOS
Consumer, excluding credit card allowance, to total
consumer, excluding credit card retained loans
Credit card allowance to total credit card retained loans
Wholesale allowance to total wholesale retained loans
Wholesale allowance to total wholesale retained loans,
excluding trade finance and conduits (b)
Total allowance to total retained loans
Consumer, excluding credit card allowance, to consumer,
excluding credit card retained nonaccrual loans (c)
Total allowance, excluding credit card allowance, to retained
nonaccrual loans, excluding credit card nonaccrual loans (c)
Wholesale allowance to wholesale retained nonaccrual loans
Total allowance to total retained nonaccrual loans
$
Dec 31,
2023
(876)
2,732
1,856
12,450
12,450
14,306
392
7,722
8,114
22,420
1,974
128
24,522
0.47 %
5.90
1.21
1.31
1.75
51
166
346
374
(d)
(d)
$
Sep 30,
2023
(942)
2,796
1,854
11,900
11,900
13,754
732
7,460
8,192
21,946
2,075
117
$ 24,138
0.47 %
6.04
1.22
1.33
1.73
49
151
282
329
(d)
(d)
$
Jun 30,
2023
(971)
3,019
2,048
11,600
11,600
13,648
0.52 %
6.06
1.25
478
7,854
8,332 (d)
21,980
2,186
104
$ 24,270
1.36
1.75
54
JPMORGAN CHASE & CO.
163
321
345
(d)
Mar 31,
2023
$ (1,030)
2,696
1,666
$
11,400
11,400
13,066
437
6,550
6,987
20,053
2,370
90
22,513
0.55 %
6.33
1.16
1.26
1.85
43
143
316
331
$
$
Dec 31,
2022
(624)
2,664
2,040
223
10,977
11,200
13,240
467
6,019
6,486
19,726
2,382
96
22,204
0.68 %
6.05
1.07
1.17
1.81
53
146
330
338
(e)
(e)
Dec 31, 2023
Change
Sep 30,
2023
7%
(2)
5
5
4
(46)
4
(1)
2
(5)
9
2
Dec 31,
2022
(40)%
3
(9)
NM
13
11
8
(16)
28
25
14
(17)
33
10
(a) On January 1, 2023, the Firm adopted the Financial Instruments - Credit Losses: Troubled Debt Restructurings accounting guidance under which it elected to change from an asset-specific allowance approach to its non-DCF, portfolio-based allowance approach for modified loans
to troubled borrowers for all portfolios except collateral-dependent loans and nonaccrual risk-rated loans, for which the asset-specific allowance approach will continue to apply.
(b) Management uses allowance for loan losses to period-end loans retained, excluding CIB's trade finance and conduits, a non-GAAP financial measure, to provide a more meaningful assessment of the wholesale allowance coverage ratio.
(c) Refer to footnote (a) on page 26 for information on the Firm's nonaccrual policy for credit card loans.
(d) At December 31, 2023, September 30, 2023 and June 30, 2023, included $396 million, $396 million and $377 million of Consumer, respectively, and $800 million, $667 million and $695 million of Wholesale, respectively, associated with First Republic.
(e) Prior-period amounts have been revised to conform with the current presentation.
Page 28View entire presentation