Silicon Valley Bank Results Presentation Deck
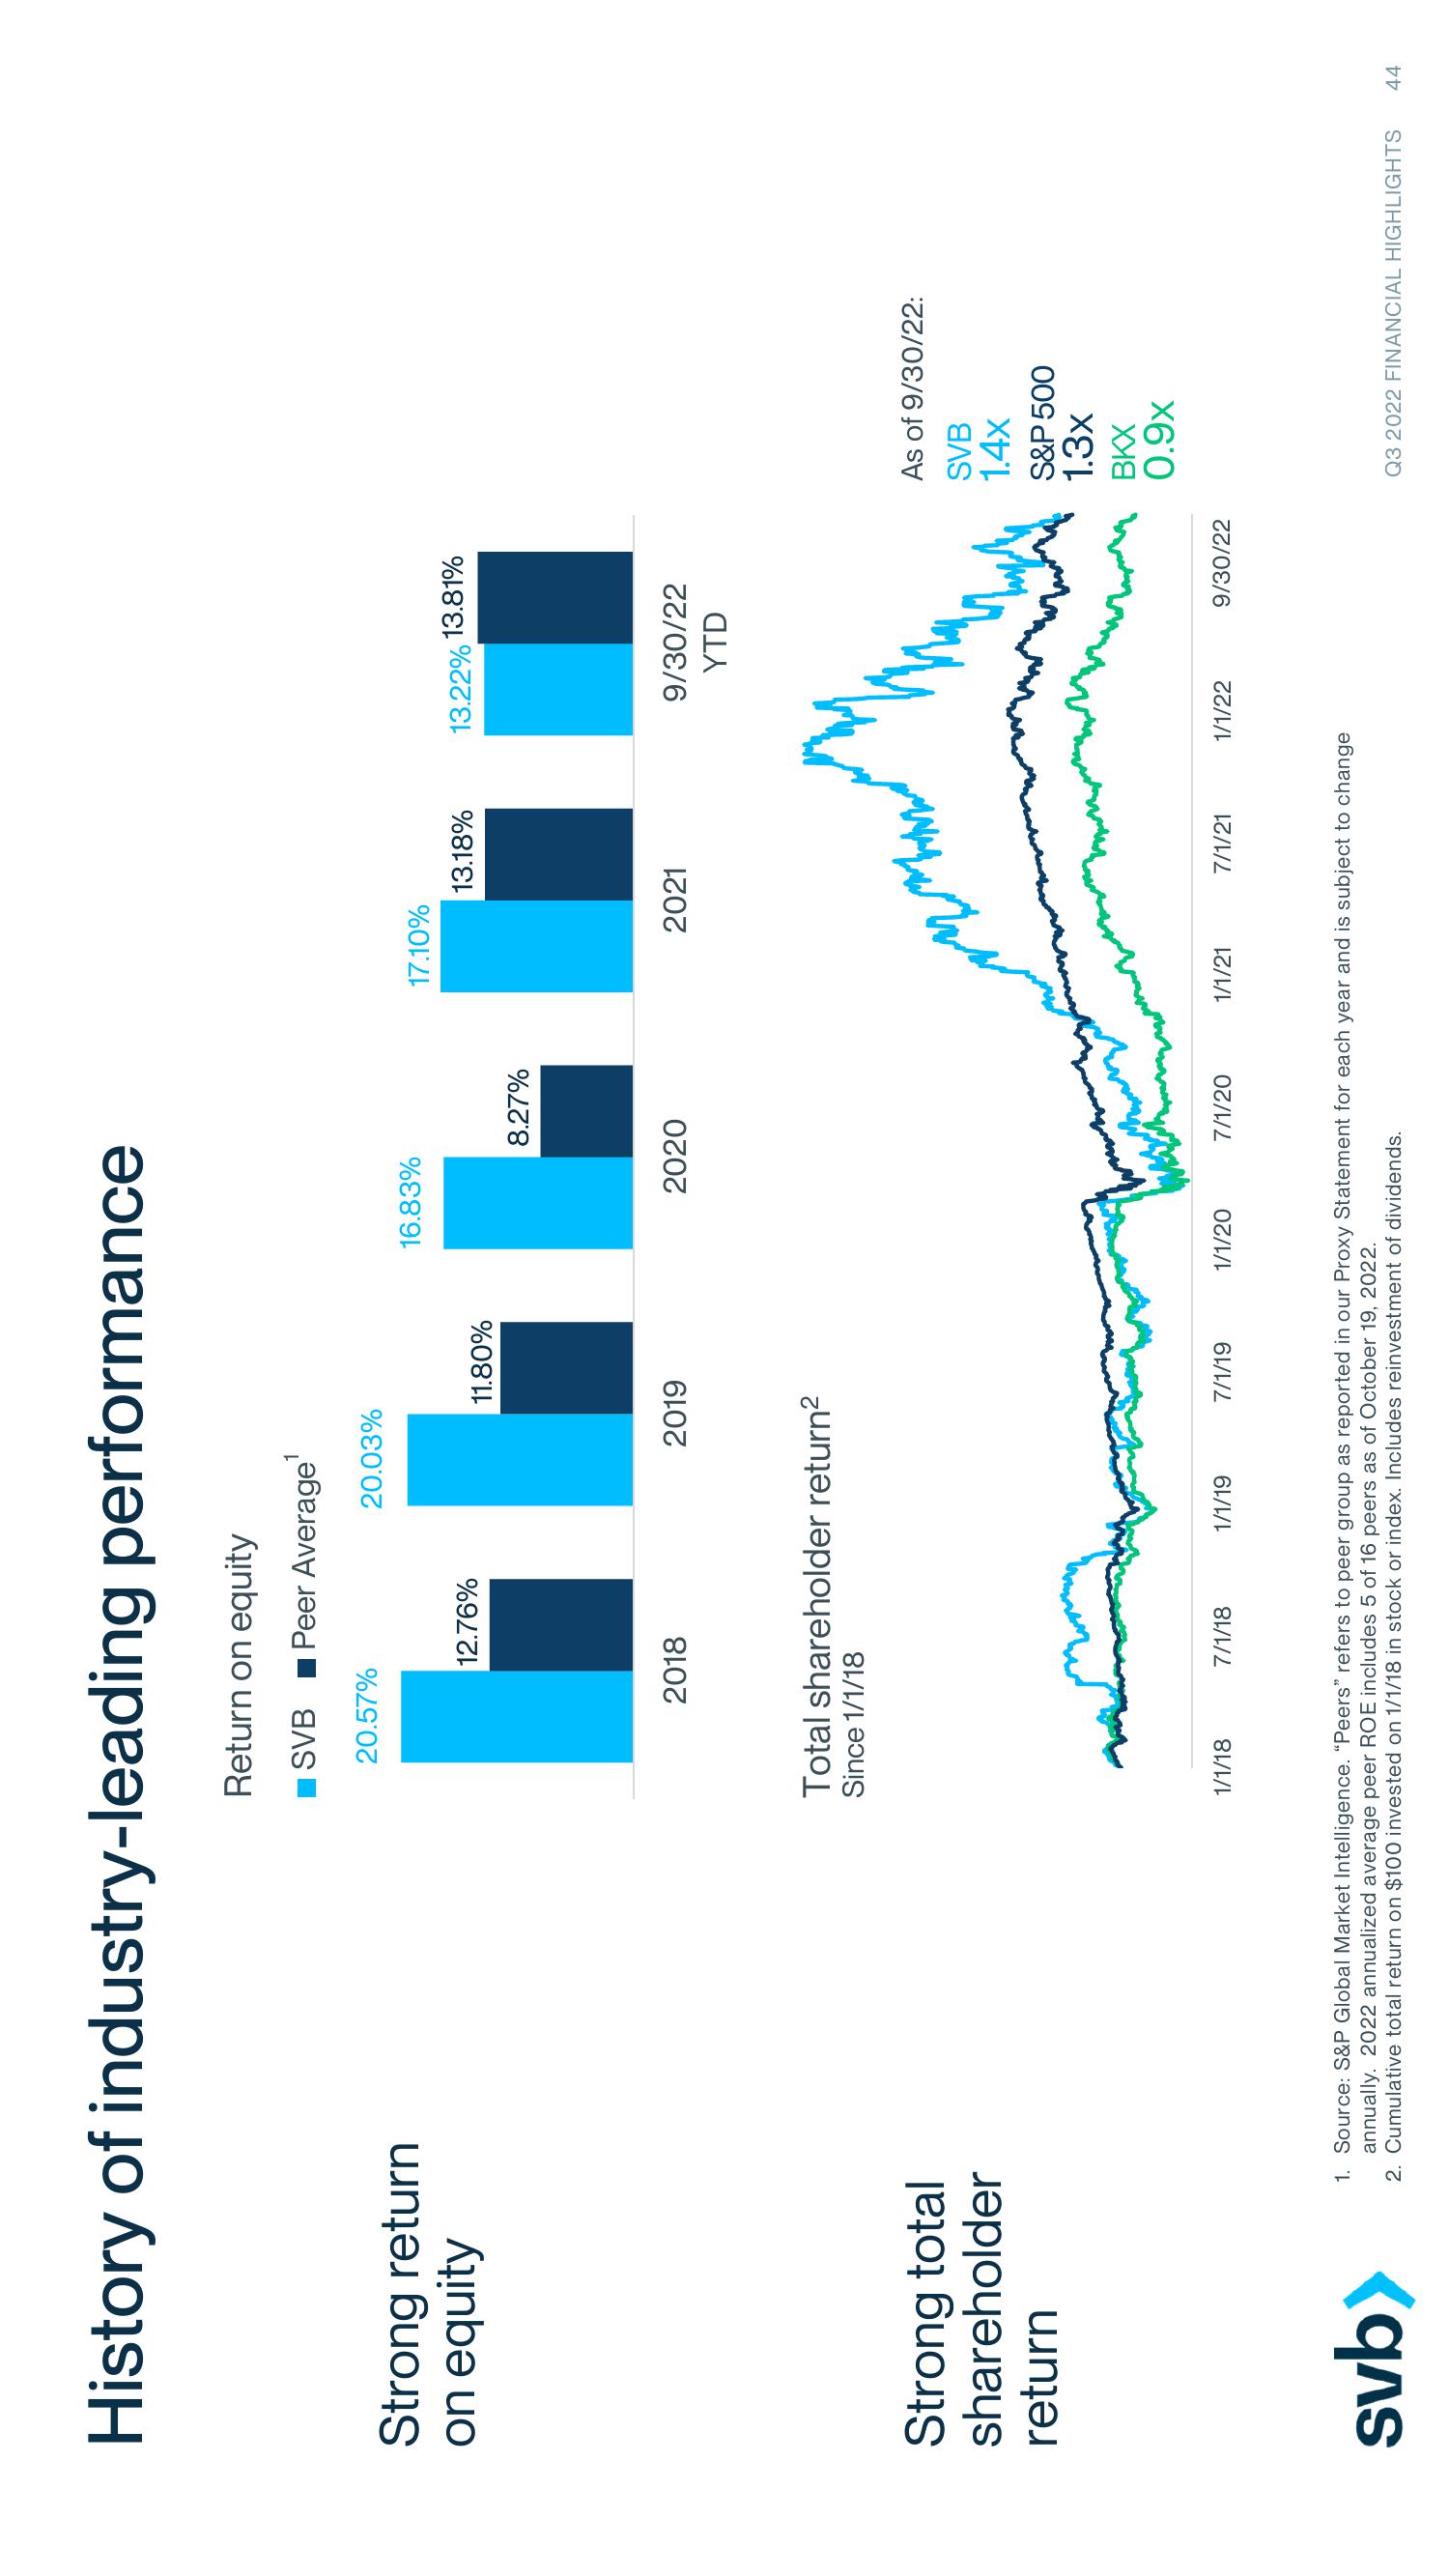
History of industry-leading performance
Strong return
on equity
Strong total
shareholder
return
svb>
Return on equity
SVB Peer Average'
20.57%
12.76%
1/1/18
2018
20.03%
7/1/18
Total shareholder return²
Since 1/1/18
11.80%
1/1/19
2019
7/1/19
16.83%
1/1/20
8.27%
2020
7/1/20
17.10%
1/1/21
13.18%
2021
7/1/21
13.22% 13.81%
9/30/22
YTD
1. Source: S&P Global Market Intelligence. "Peers" refers to peer group as reported in our Proxy Statement for each year and is subject to change
annually. 2022 annualized average peer ROE includes 5 of 16 peers as of October 19, 2022.
2. Cumulative total return on $100 invested on 1/1/18 in stock or index. Includes reinvestment of dividends.
www
1/1/22
9/30/22
As of 9/30/22:
SVB
1.4x
S&P 500
1.3x
BKX
0.9x
Q3 2022 FINANCIAL HIGHLIGHTS 44View entire presentation