Uber Results Presentation Deck
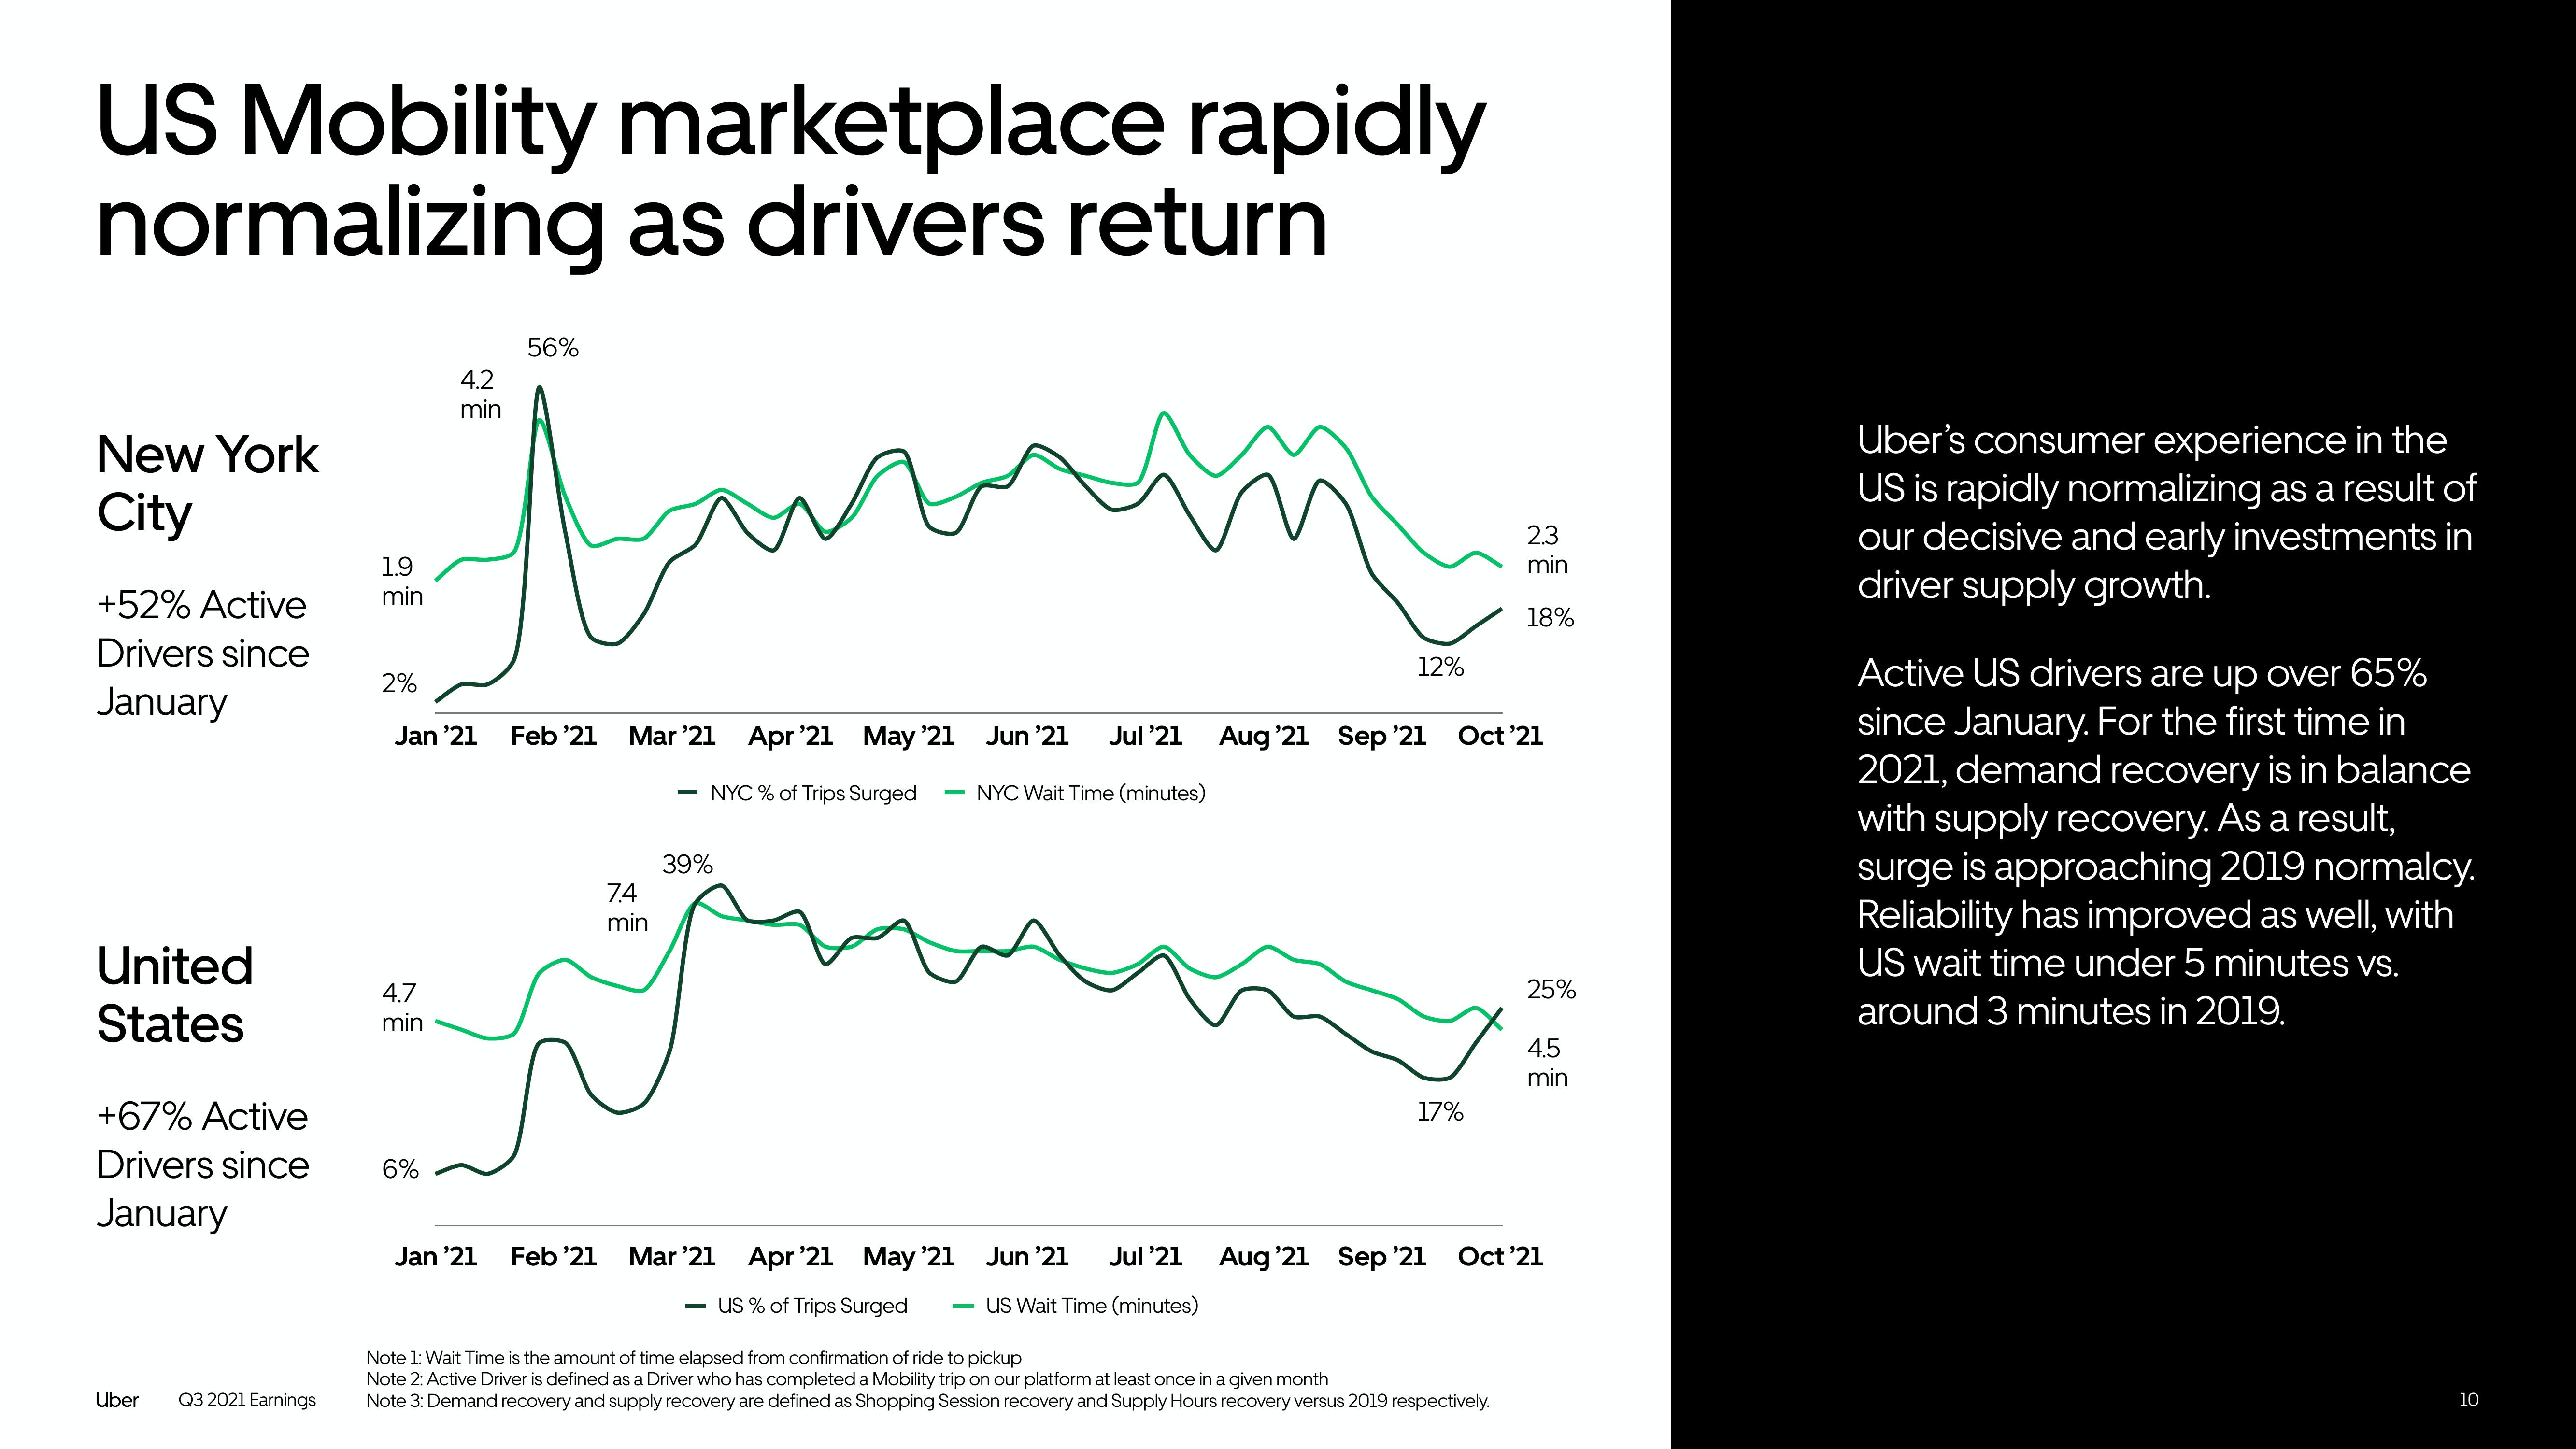
Us Mobility marketplace rapidly
us
normalizing
as drivers return
New York
City
+52% Active
Drivers since
January
United
States
+67% Active
Drivers since
January
Uber
Q3 2021 Earnings
tumin
1.9
2%
4.7
min
4.2
Jan '21
6%
min
56%
Jan '21
Feb '21 Mar '21 Apr '21 May '21
Feb '21
7.4
min
Jun '21
39%
Jul '21
- NYC % of Trips Surged - NYC Wait Time (minutes)
Mar '21 Apr '21 May '21 Jun '21 Jul '21
- US % of Trips Surged - US Wait Time (minutes)
12%
Aug '21 Sep '21
17%
Aug '21 Sep '21
Oct '21
2.3
min
18%
Note 1: Wait Time is the amount of time elapsed from confirmation of ride to pickup
Note 2: Active Driver is defined as a Driver who has completed a Mobility trip on our platform at least once in a given month
Note 3: Demand recovery and supply recovery are defined as Shopping Session recovery and Supply Hours recovery versus 2019 respectively.
25%
4.5
min
Oct '21
Uber's consumer experience in the
US is rapidly normalizing as a result of
our decisive and early investments in
driver supply growth.
Active US drivers are up over 65%
since January. For the first time in
2021, demand recovery is in balance
with supply recovery. As a result,
surge is approaching 2019 normalcy.
Reliability has improved as well, with
US wait time under 5 minutes vs.
around 3 minutes in 2019.
10View entire presentation