Procore IPO Presentation Deck
80%
Gross Margin
As % of Revenue
FY-18
83%
83%
84%
Demonstrated Leverage
FY-19 FY-20 Q1-21
Non-GAAP Gross Margin
Operating Expenses
As % of Revenue
59%
29%
18%
FY-18
57%
28%
19%
S&M
FY-19
43%
27%
14%
R&D
44%
27%
13%
FY-20 Q1-21
G&A
(11%)
(25%)
Operating Margins
As % of Revenue
(2%)
(21%)
5%
(1%)
FY-18 FY-19 FY-20
Non-GAAP Op Margin
......
25%
(1%)
Q1-21
OCF Margin
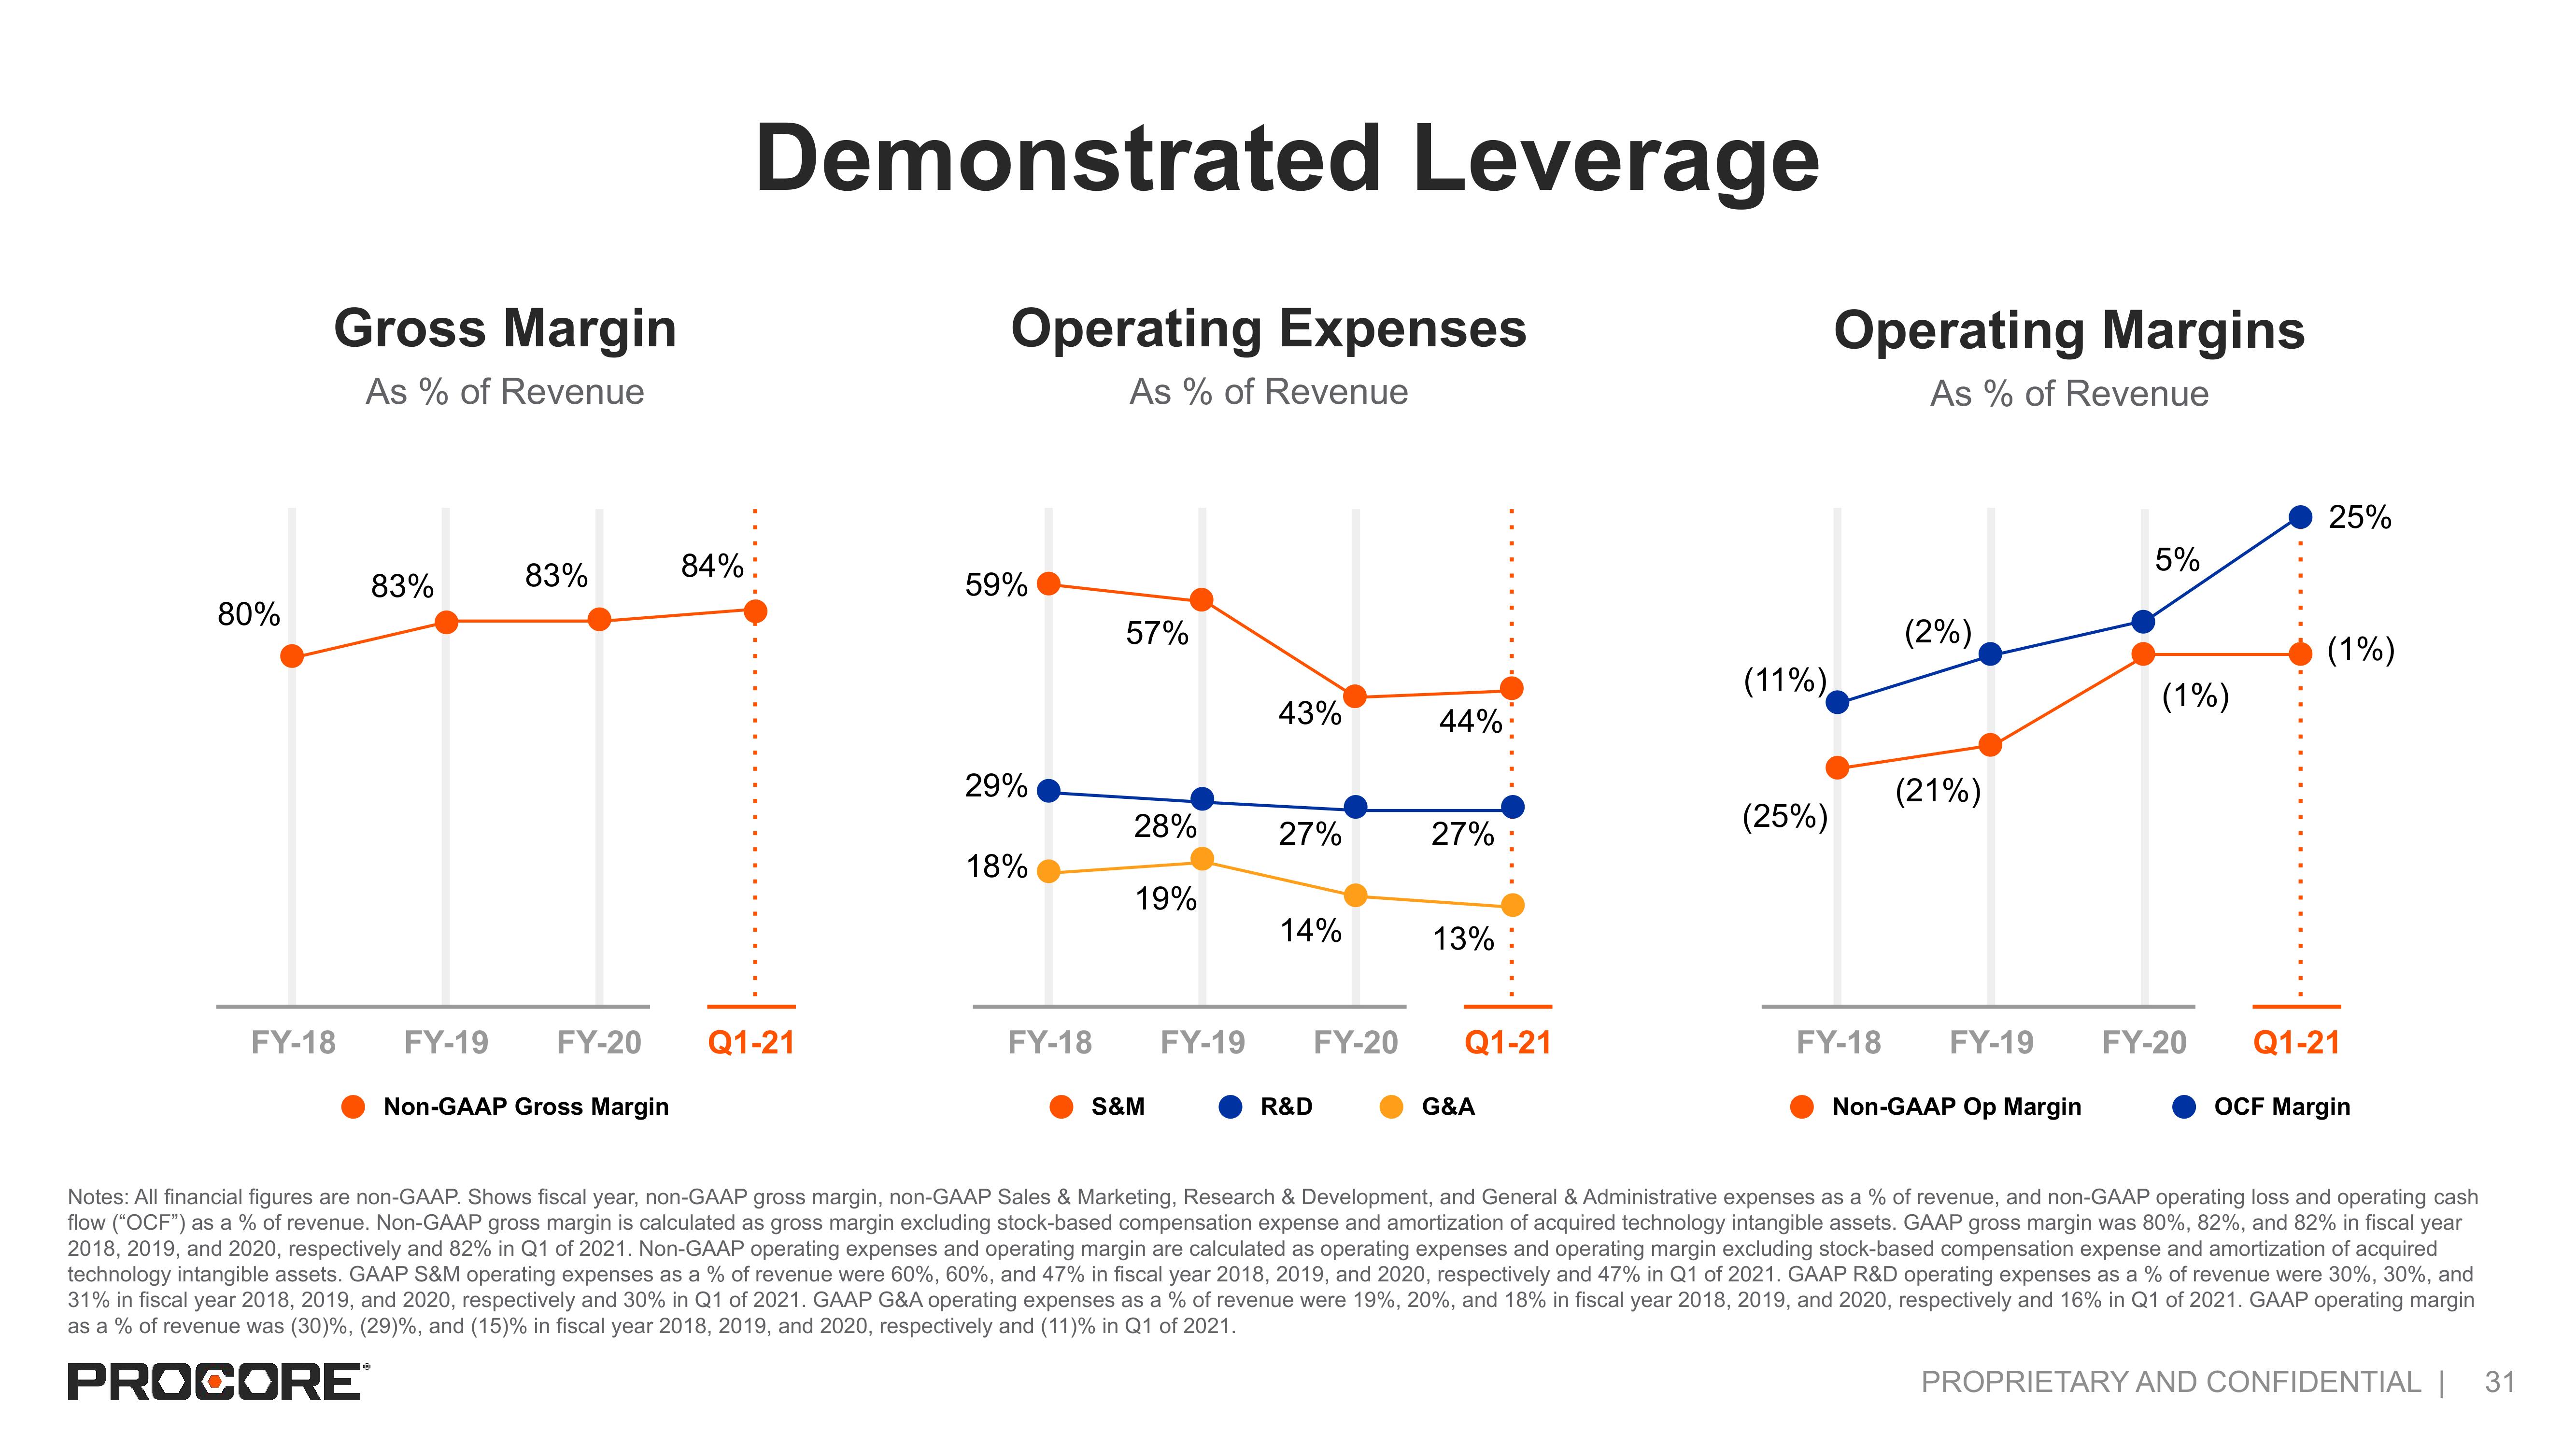
Notes: All financial figures are non-GAAP. Shows fiscal year, non-GAAP gross margin, non-GAAP Sales & Marketing, Research & Development, and General & Administrative expenses as a % of revenue, and non-GAAP operating loss and operating cash
flow ("OCF") as a % of revenue. Non-GAAP gross margin is calculated as gross margin excluding stock-based compensation expense and amortization of acquired technology intangible assets. GAAP gross margin was 80%, 82%, and 82% in fiscal year
2018, 2019, and 2020, respectively and 82% in Q1 of 2021. Non-GAAP operating expenses and operating margin are calculated as operating expenses and operating margin excluding stock-based compensation expense and amortization of acquired
technology intangible assets. GAAP S&M operating expenses as a % of revenue were 60%, 60%, and 47% in fiscal year 2018, 2019, and 2020, respectively and 47% in Q1 of 2021. GAAP R&D operating expenses as a % of revenue were 30%, 30%, and
31% in fiscal year 2018, 2019, and 2020, respectively and 30% in Q1 of 2021. GAAP G&A operating expenses as a % of revenue were 19%, 20%, and 18% in fiscal year 2018, 2019, and 2020, respectively and 16% in Q1 of 2021. GAAP operating margin
as a % of revenue was (30)%, (29) %, and (15) % in fiscal year 2018, 2019, and 2020, respectively and (11) % in Q1 of 2021.
PROCORE
PROPRIETARY AND CONFIDENTIAL |
31View entire presentation