J.P.Morgan Results Presentation Deck
JPMORGAN CHASE & CO.
CONSUMER & COMMUNITY BANKING
FINANCIAL HIGHLIGHTS, CONTINUED
(in millions, except ratio data)
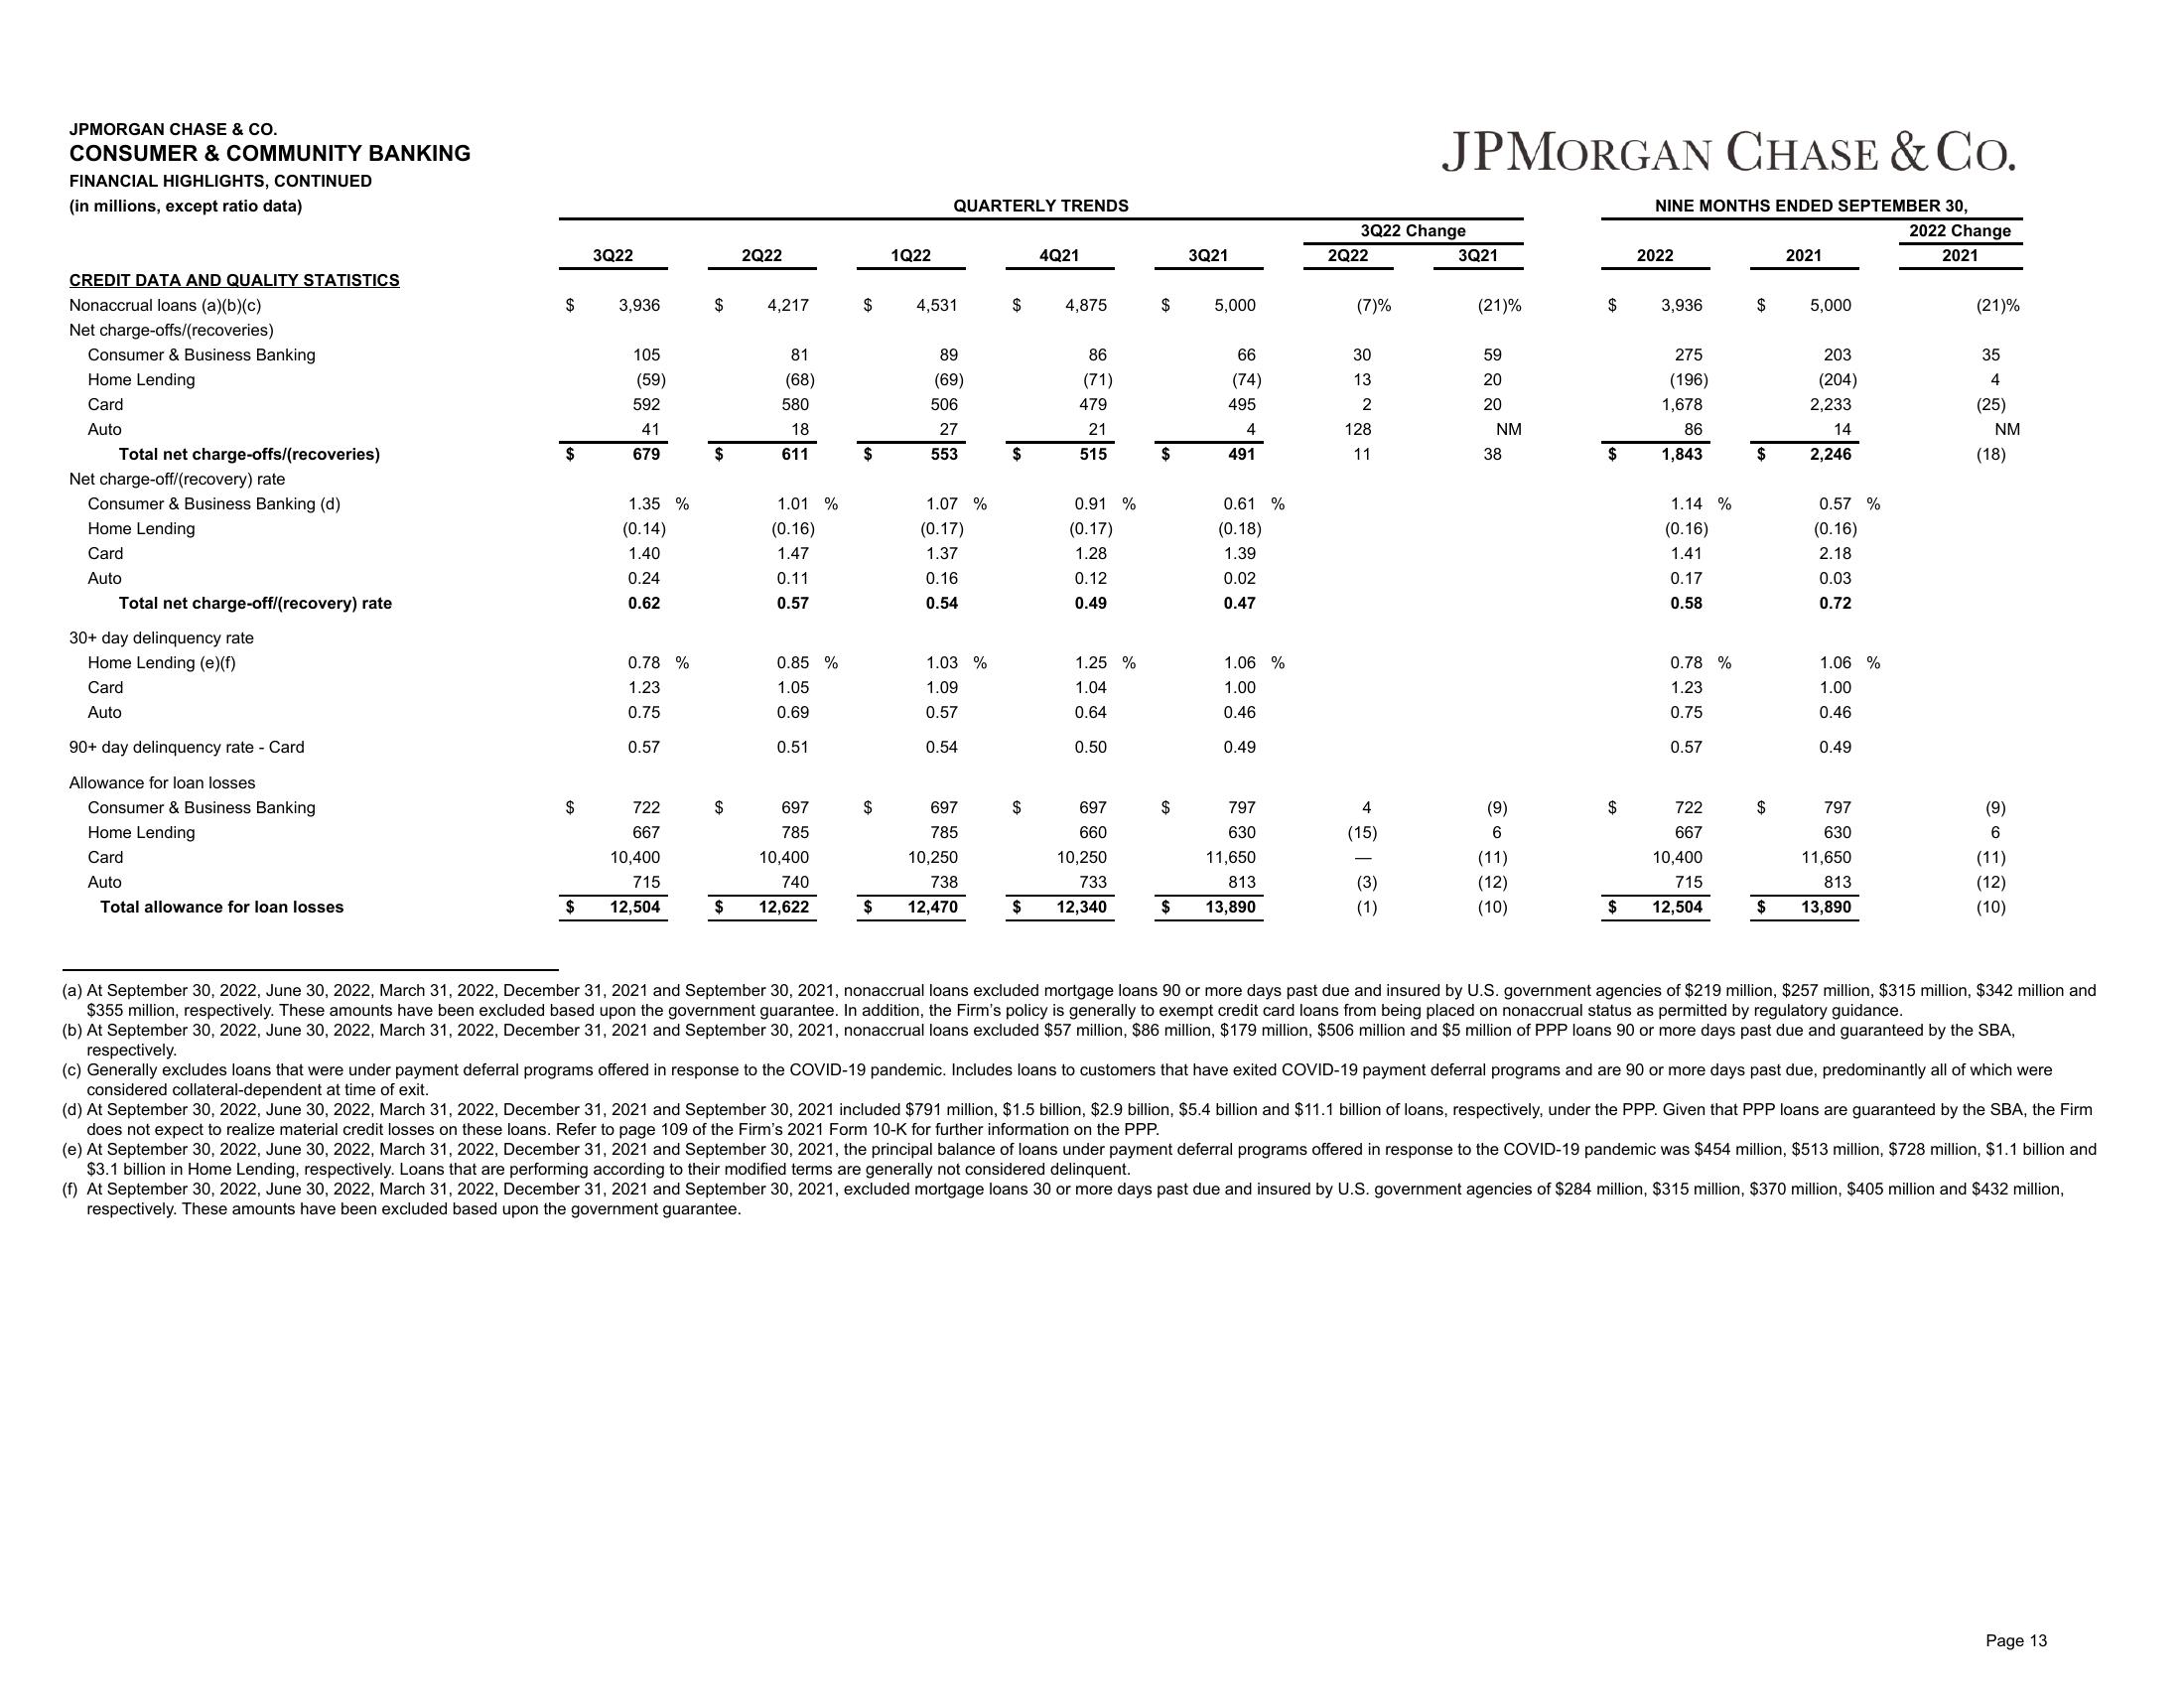
CREDIT DATA AND QUALITY STATISTICS
Nonaccrual loans (a)(b)(c)
Net charge-offs/(recoveries)
Consumer & Business Banking
Home Lending
Card
Auto
Total net charge-offs/(recoveries)
Net charge-off/(recovery) rate
Consumer & Business Banking (d)
Home Lending
Card
Auto
Total net charge-off/(recovery) rate
30+ day delinquency rate
Home Lending (e)(f)
Card
Auto
90+ day delinquency rate - Card
Allowance for loan losses
Consumer & Business Banking
Home Lending
Card
Auto
Total allowance for loan losses
$
$
$
$
3Q22
3,936
105
(59)
592
41
679
1.35 %
(0.14)
1.40
0.24
0.62
0.78 %
1.23
0.75
0.57
722
667
10,400
715
12,504
$
$
$
2Q22
4,217
81
(68)
580
18
611
1.01 %
(0.16)
1.47
0.11
0.57
0.85 %
1.05
0.69
0.51
697
785
10,400
740
12,622
$
$
$
1Q22
QUARTERLY TRENDS
4,531
89
(69)
506
27
553
1.07 %
(0.17)
1.37
0.16
0.54
1.03 %
1.09
0.57
0.54
697
785
10,250
738
12,470
$
$
$
4Q21
4,875
86
(71)
479
21
515
0.91 %
(0.17)
1.28
0.12
0.49
1.25 %
1.04
0.64
0.50
697
660
10,250
733
12,340
$
$
$
$
3Q21
5,000
66
(74)
495
4
491
0.61 %
(0.18)
1.39
0.02
0.47
1.06 %
1.00
0.46
0.49
797
630
11,650
813
13,890
3Q22 Change
2Q22
(7)%
30
13
2
128
11
4
(15)
|
JPMORGAN CHASE & CO.
(3)
(1)
3Q21
(21)%
59
20
20
NM
38
(9)
6
(11)
(12)
(10)
$
$
$
$
NINE MONTHS ENDED SEPTEMBER 30,
2022
3,936
275
(196)
1,678
86
1,843
1.14 %
(0.16)
1.41
0.17
0.58
0.78 %
1.23
0.75
0.57
722
667
10,400
715
12,504
$
$
$
$
2021
5,000
203
(204)
2,233
14
2,246
0.57 %
(0.16)
2.18
0.03
0.72
1.06 %
1.00
0.46
0.49
797
630
11,650
813
13,890
2022 Change
2021
(21)%
35
4
(25)
NM
(18)
(9)
6
(11)
(12)
(10)
(a) At September 30, 2022, June 30, 2022, March 31, 2022, December 31, 2021 and September 30, 2021, nonaccrual loans excluded mortgage loans 90 or more days past due and insured by U.S. government agencies of $219 million, $257 million, $315 million, $342 million and
$355 million, respectively. These amounts have been excluded based upon the government guarantee. In addition, the Firm's policy is generally to exempt credit card loans from being placed on nonaccrual status as permitted by regulatory guidance.
(b) At September 30, 2022, June 30, 2022, March 31, 2022, December 31, 2021 and September 30, 2021, nonaccrual loans excluded $57 million, $86 million, $179 million, $506 million and $5 million of PPP loans 90 or more days past due and guaranteed by the SBA,
respectively.
(c) Generally excludes loans that were under payment deferral programs offered in response to the COVID-19 pandemic. Includes loans to customers that have exited COVID-19 payment deferral programs and are 90 or more days past due, predominantly all of which were
considered collateral-dependent at time of exit.
(d) At September 30, 2022, June 30, 2022, March 31, 2022, December 31, 2021 and September 30, 2021 included $791 million, $1.5 billion, $2.9 billion, $5.4 billion and $11.1 billion of loans, respectively, under the PPP. Given that PPP loans are guaranteed by the SBA, the Firm
does not expect to realize material credit losses on these loans. Refer to page 109 of the Firm's 2021 Form 10-K for further information on the PPP.
(e) At September 30, 2022, June 30, 2022, March 31, 2022, December 31, 2021 and September 30, 2021, the principal balance of loans under payment deferral programs offered in response to the COVID-19 pandemic was $454 million, $513 million, $728 million, $1.1 billion and
$3.1 billion in Home Lending, respectively. Loans that are performing according to their modified terms are generally not considered delinquent.
(f) At September 30, 2022, June 30, 2022, March 31, 2022, December 31, 2021 and September 30, 2021, excluded mortgage loans 30 or more days past due and insured by U.S. government agencies of $284 million, $315 million, $370 million, $405 million and $432 million,
respectively. These amounts have been excluded based upon the government guarantee.
Page 13View entire presentation