Snap Inc Results Presentation Deck
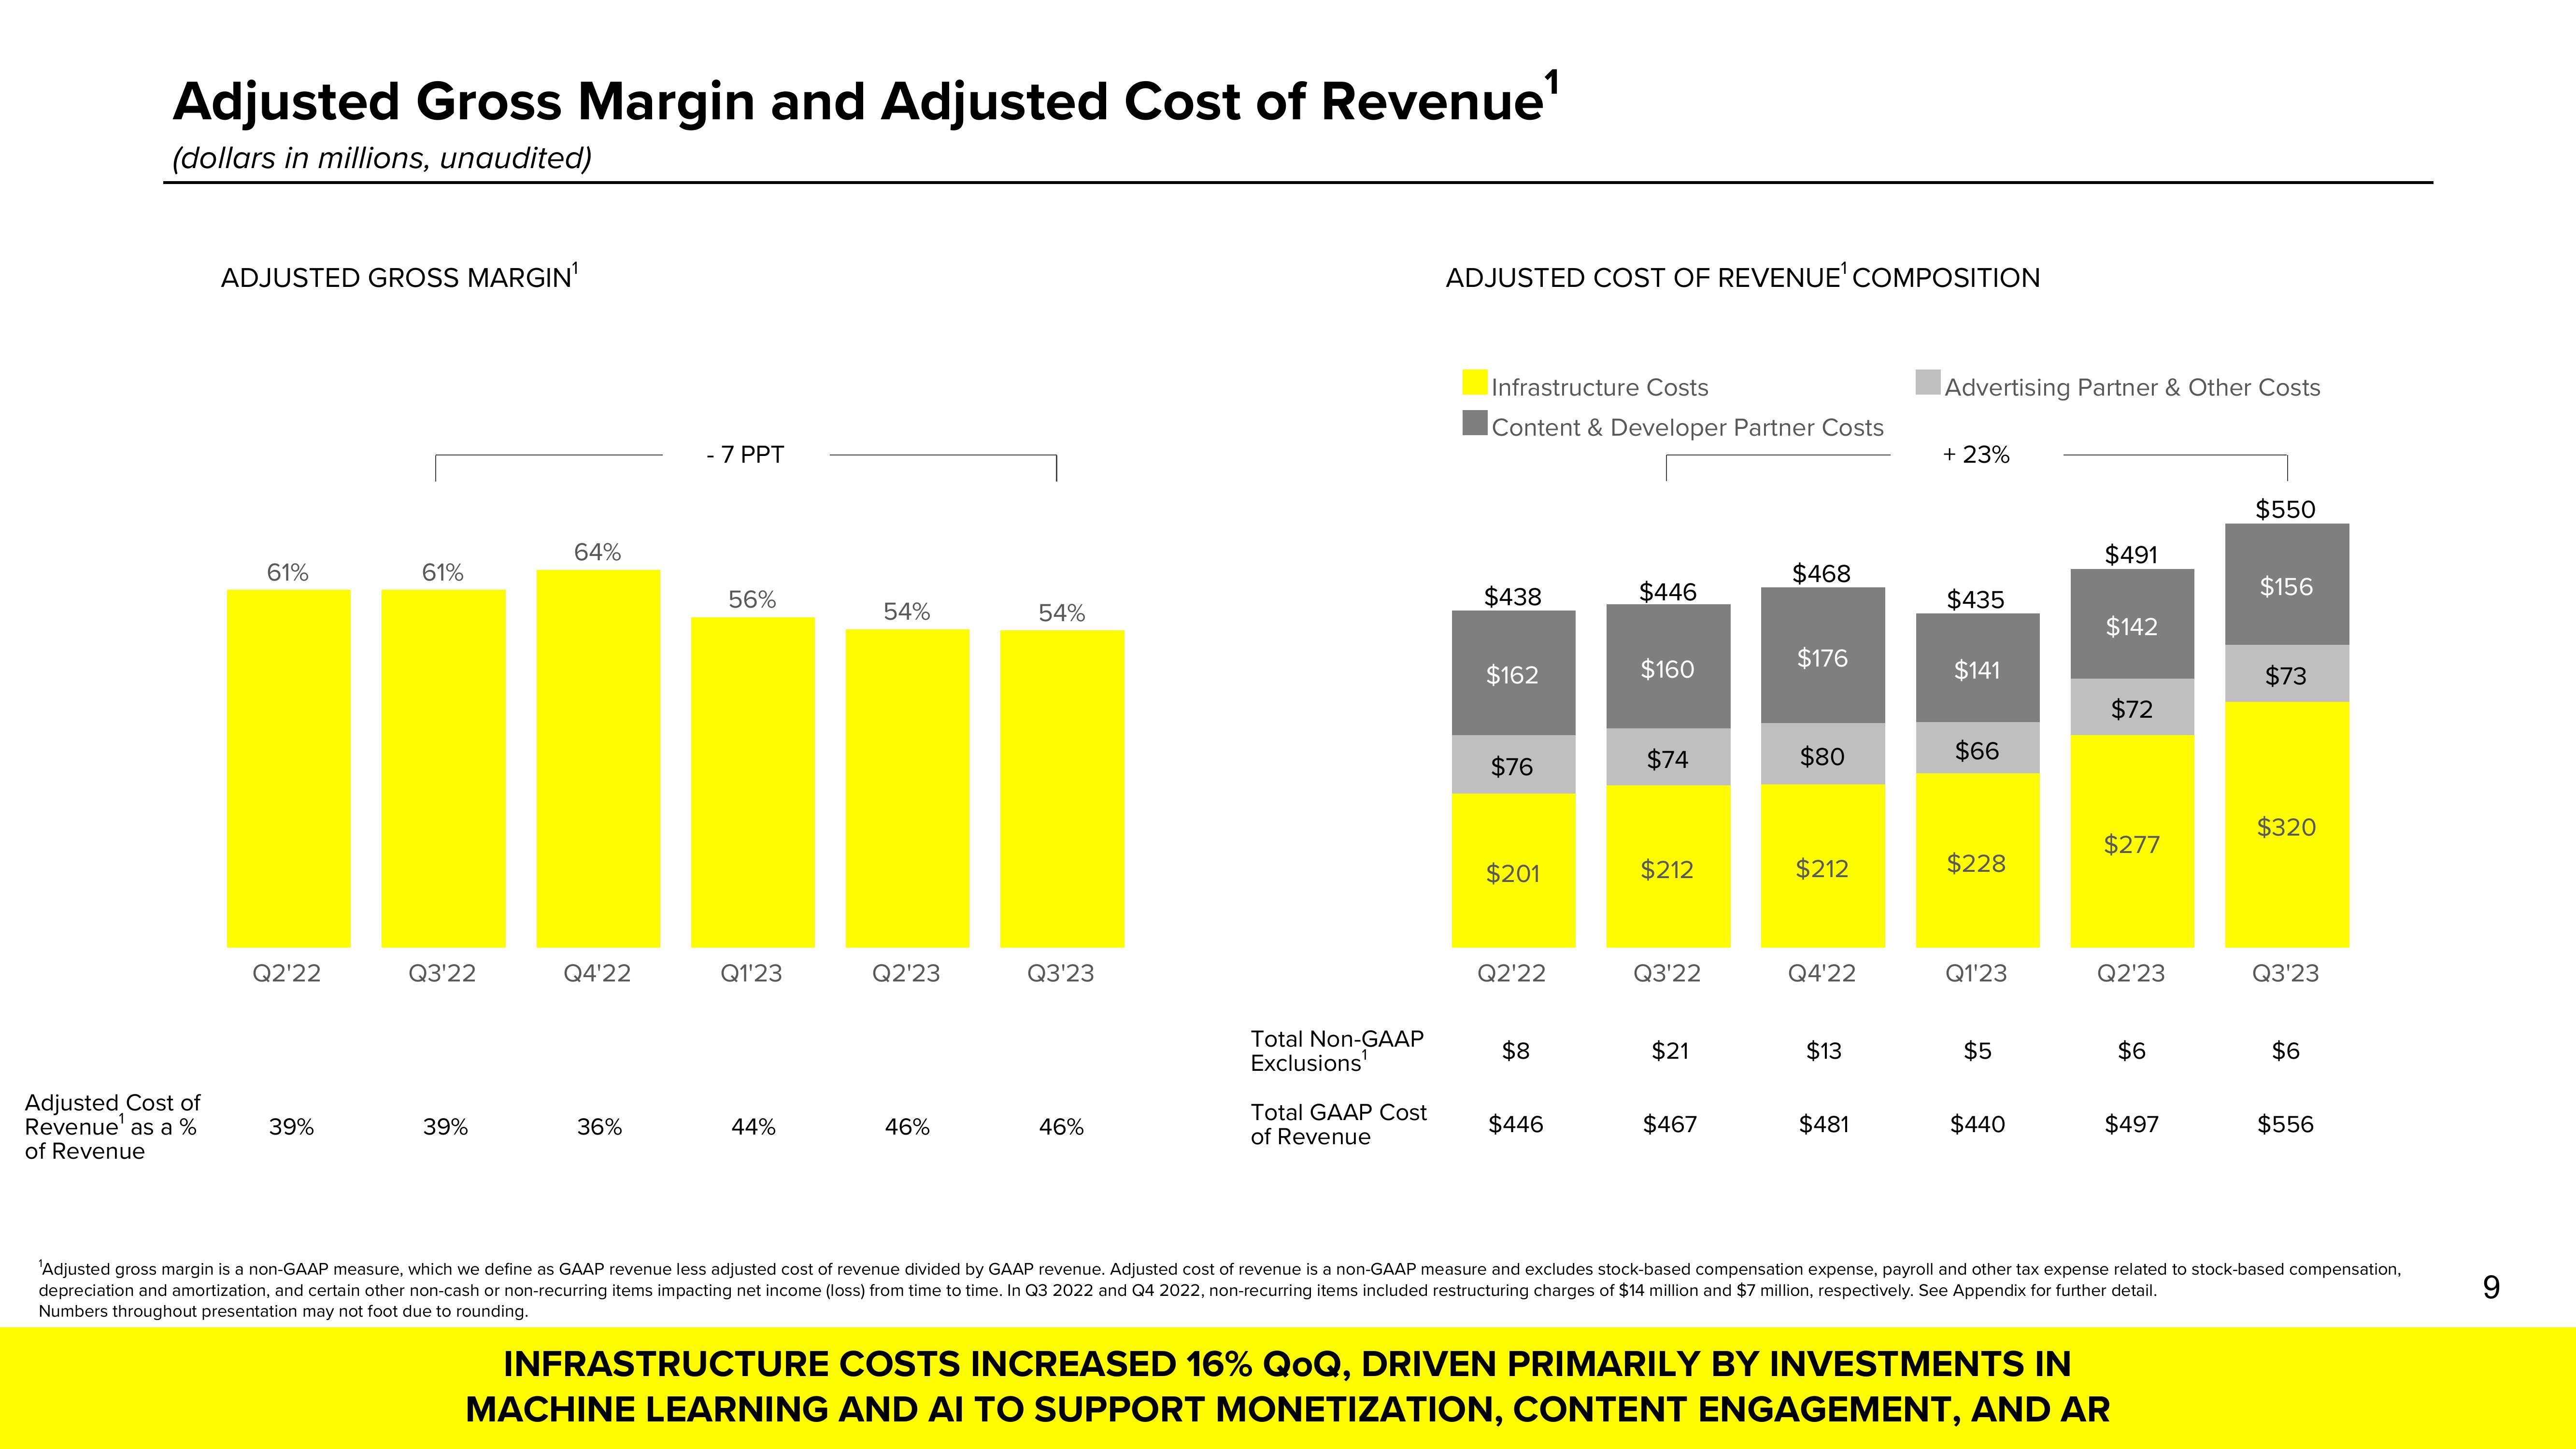
Adjusted Gross Margin and Adjusted Cost of Revenue¹
(dollars in millions, unaudited)
Adjusted Cost of
Revenue as a %
of Revenue
ADJUSTED GROSS MARGIN¹
61%
Q2'22
39%
61%
Q3'22
39%
64%
Q4'22
36%
- 7 PPT
56%
Q1'23
44%
54%
Q2'23
46%
54%
Q3'23
46%
Total Non-GAAP
Exclusions
Total GAAP Cost
of Revenue
ADJUSTED COST OF REVENUE¹ COMPOSITION
Infrastructure Costs
Content & Developer Partner Costs
$438
$162
$76
$201
Q2'22
$8
$446
$446
$160
$74
$212
Q3'22
$21
$467
$468
$176
$80
$212
Q4'22
$13
$481
Advertising Partner & Other Costs
+ 23%
$435
$141
$66
$228
Q1'23
$5
$440
$491
$142
$72
$277
Q2'23
$6
$497
INFRASTRUCTURE COSTS INCREASED 16% QOQ, DRIVEN PRIMARILY BY INVESTMENTS IN
MACHINE LEARNING AND AI TO SUPPORT MONETIZATION, CONTENT ENGAGEMENT, AND AR
$550
$156
$73
$320
Q3'23
$6
$556
'Adjusted gross margin is a non-GAAP measure, which we define as GAAP revenue less adjusted cost of revenue divided by GAAP revenue. Adjusted cost of revenue is a non-GAAP measure and excludes stock-based compensation expense, payroll and other tax expense related to stock-based compensation,
depreciation and amortization, and certain other non-cash or non-recurring items impacting net income (loss) from time to time. In Q3 2022 and Q4 2022, non-recurring items included restructuring charges of $14 million and $7 million, respectively. See Appendix for further detail.
Numbers throughout presentation may not foot due to rounding.
9View entire presentation