DraftKings Investor Day Presentation Deck
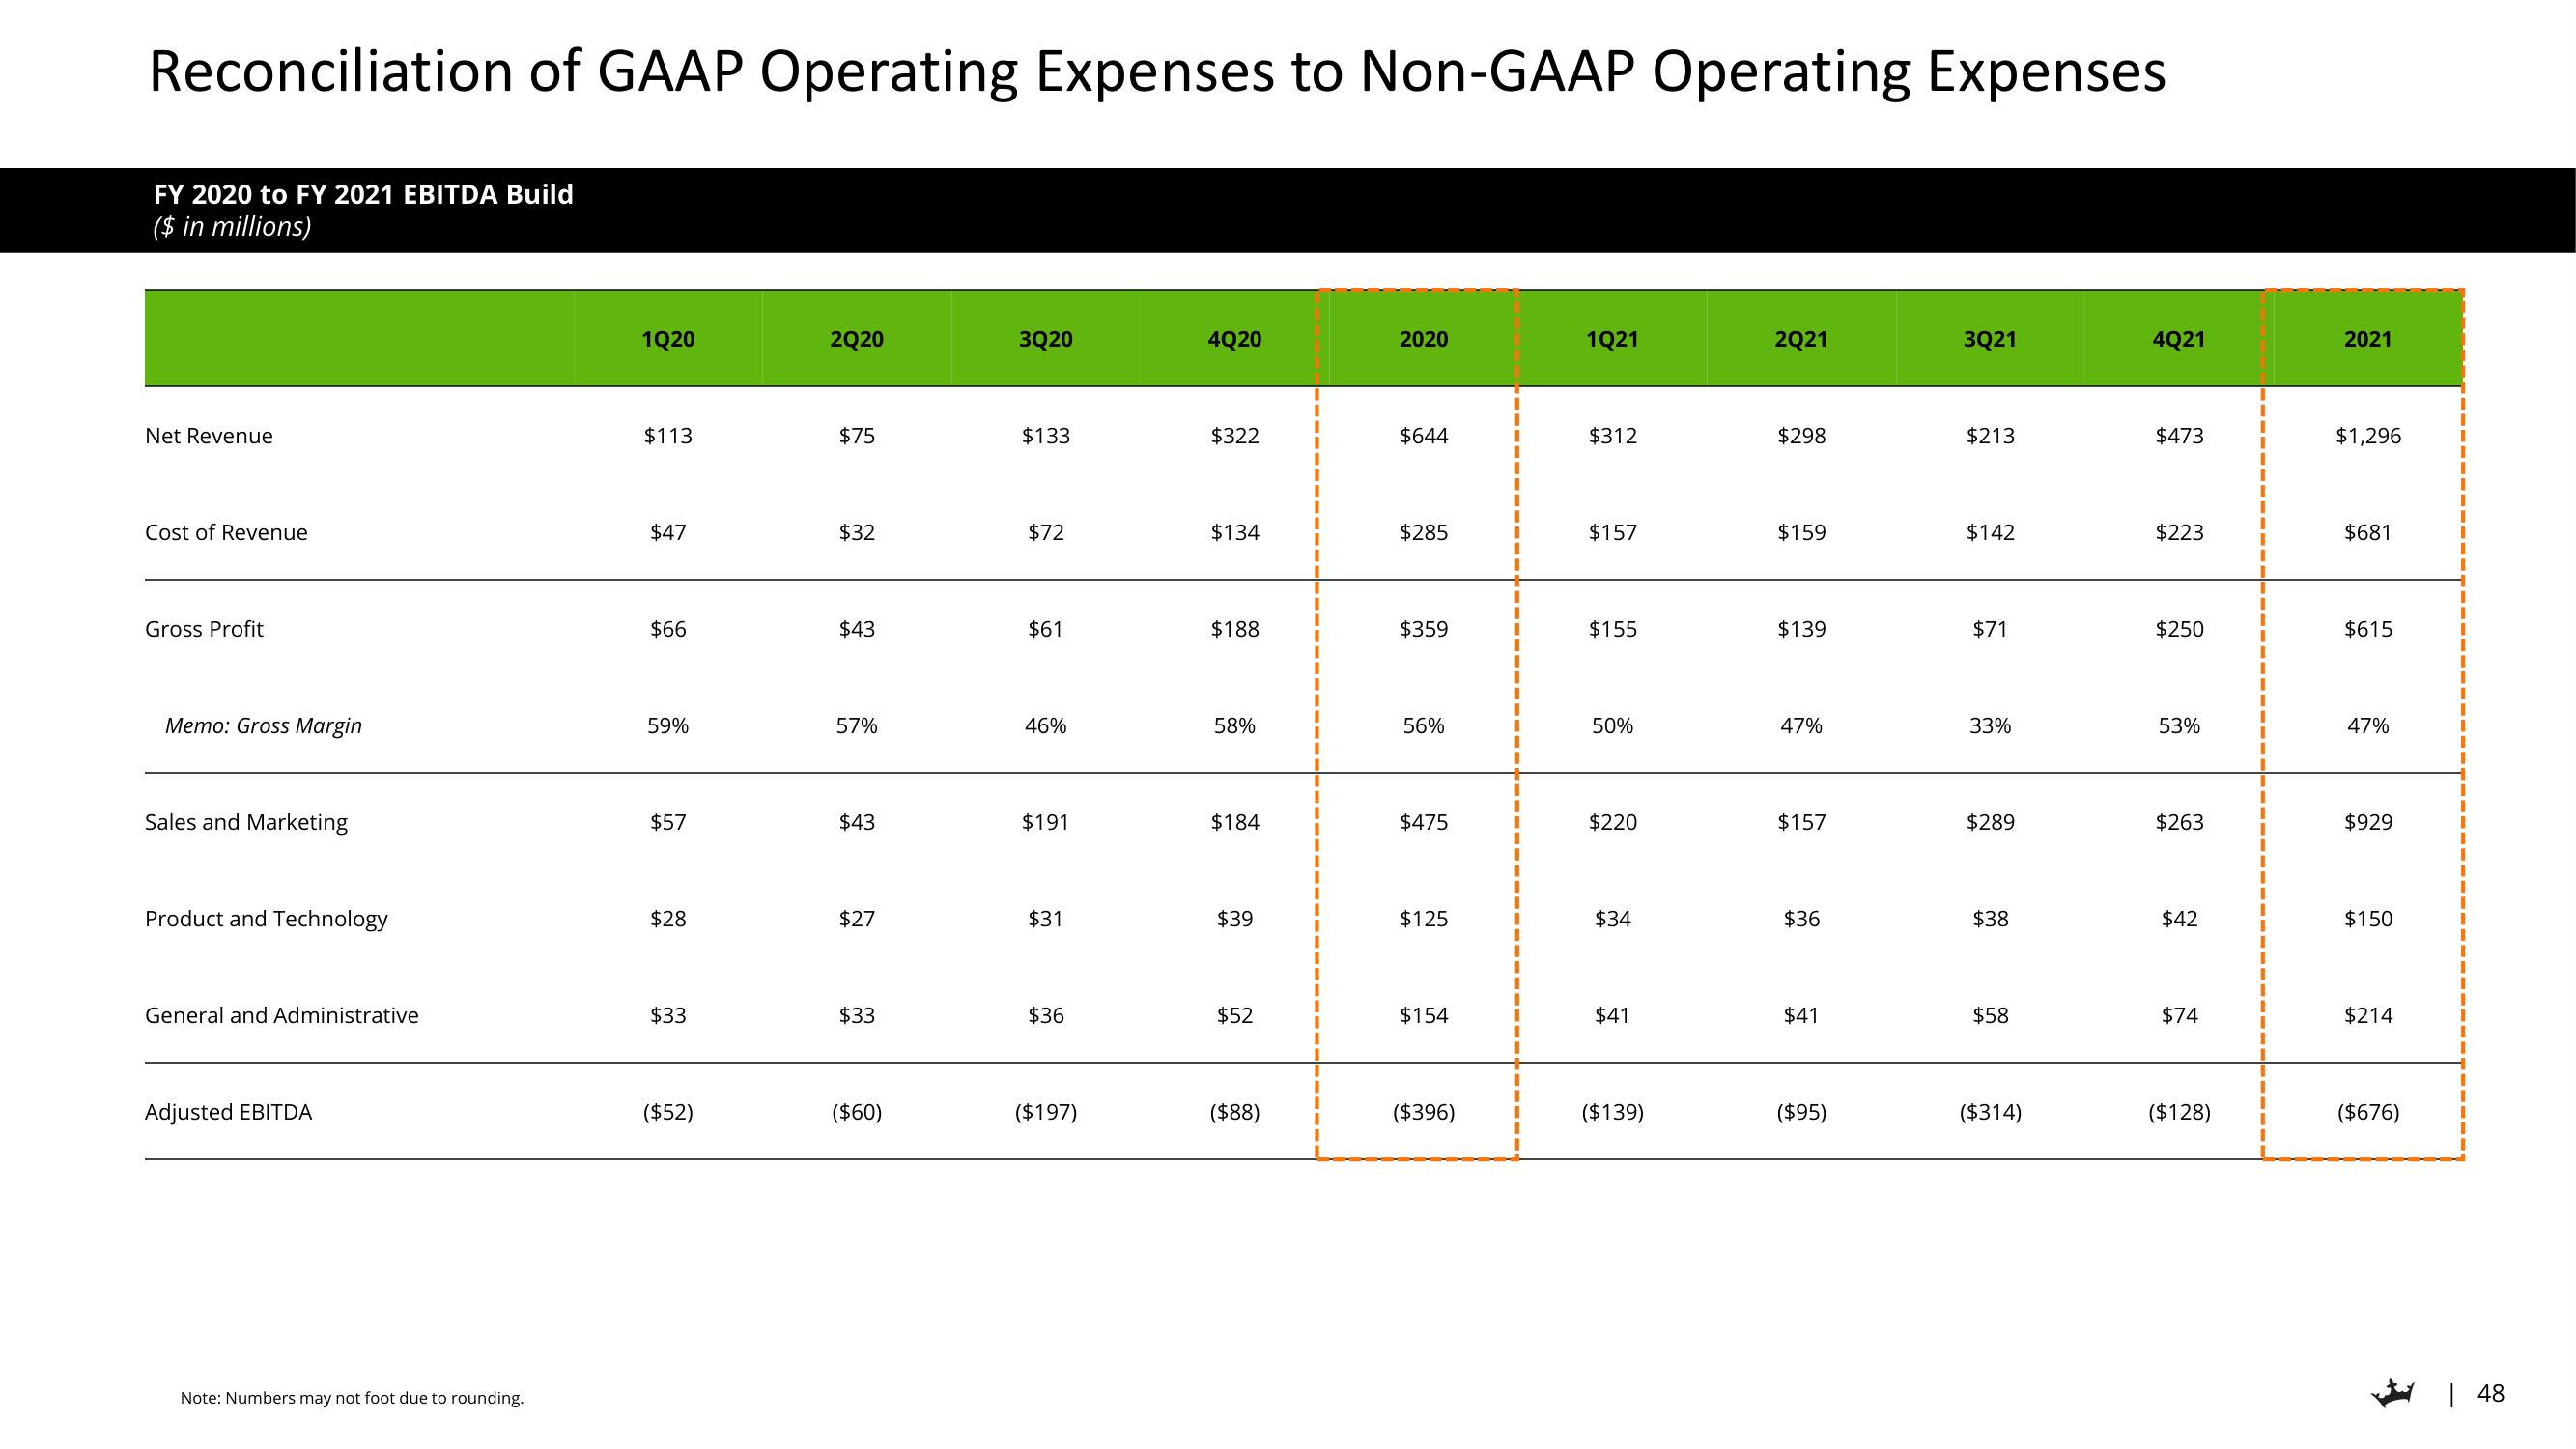
Reconciliation of GAAP Operating Expenses to Non-GAAP Operating Expenses
FY 2020 to FY 2021 EBITDA Build
($ in millions)
Net Revenue
Cost of Revenue
Gross Profit
Memo: Gross Margin
Sales and Marketing
Product and Technology
General and Administrative
Adjusted EBITDA
Note: Numbers may not foot due to rounding.
1Q20
$113
$47
$66
59%
$57
$28
$33
($52)
2Q20
$75
$32
$43
57%
$43
$27
$33
($60)
3Q20
$133
$72
$61
46%
$191
$31
$36
($197)
4Q20
$322
$134
$188
58%
$184
$39
$52
($88)
2020
$644
$285
$359
56%
$475
$125
$154
($396)
1Q21
$312
$157
$155
50%
$220
$34
$41
($139)
2Q21
$298
$159
$139
47%
$157
$36
$41
($95)
3Q21
$213
$142
$71
33%
$289
$38
$58
($314)
4Q21
$473
$223
$250
53%
$263
$42
$74
($128)
2021
$1,296
$681
$615
47%
$929
$150
$214
($676)
| 48View entire presentation