ironSource Results Presentation Deck
Q2 22 INVESTOR PRESENTATION
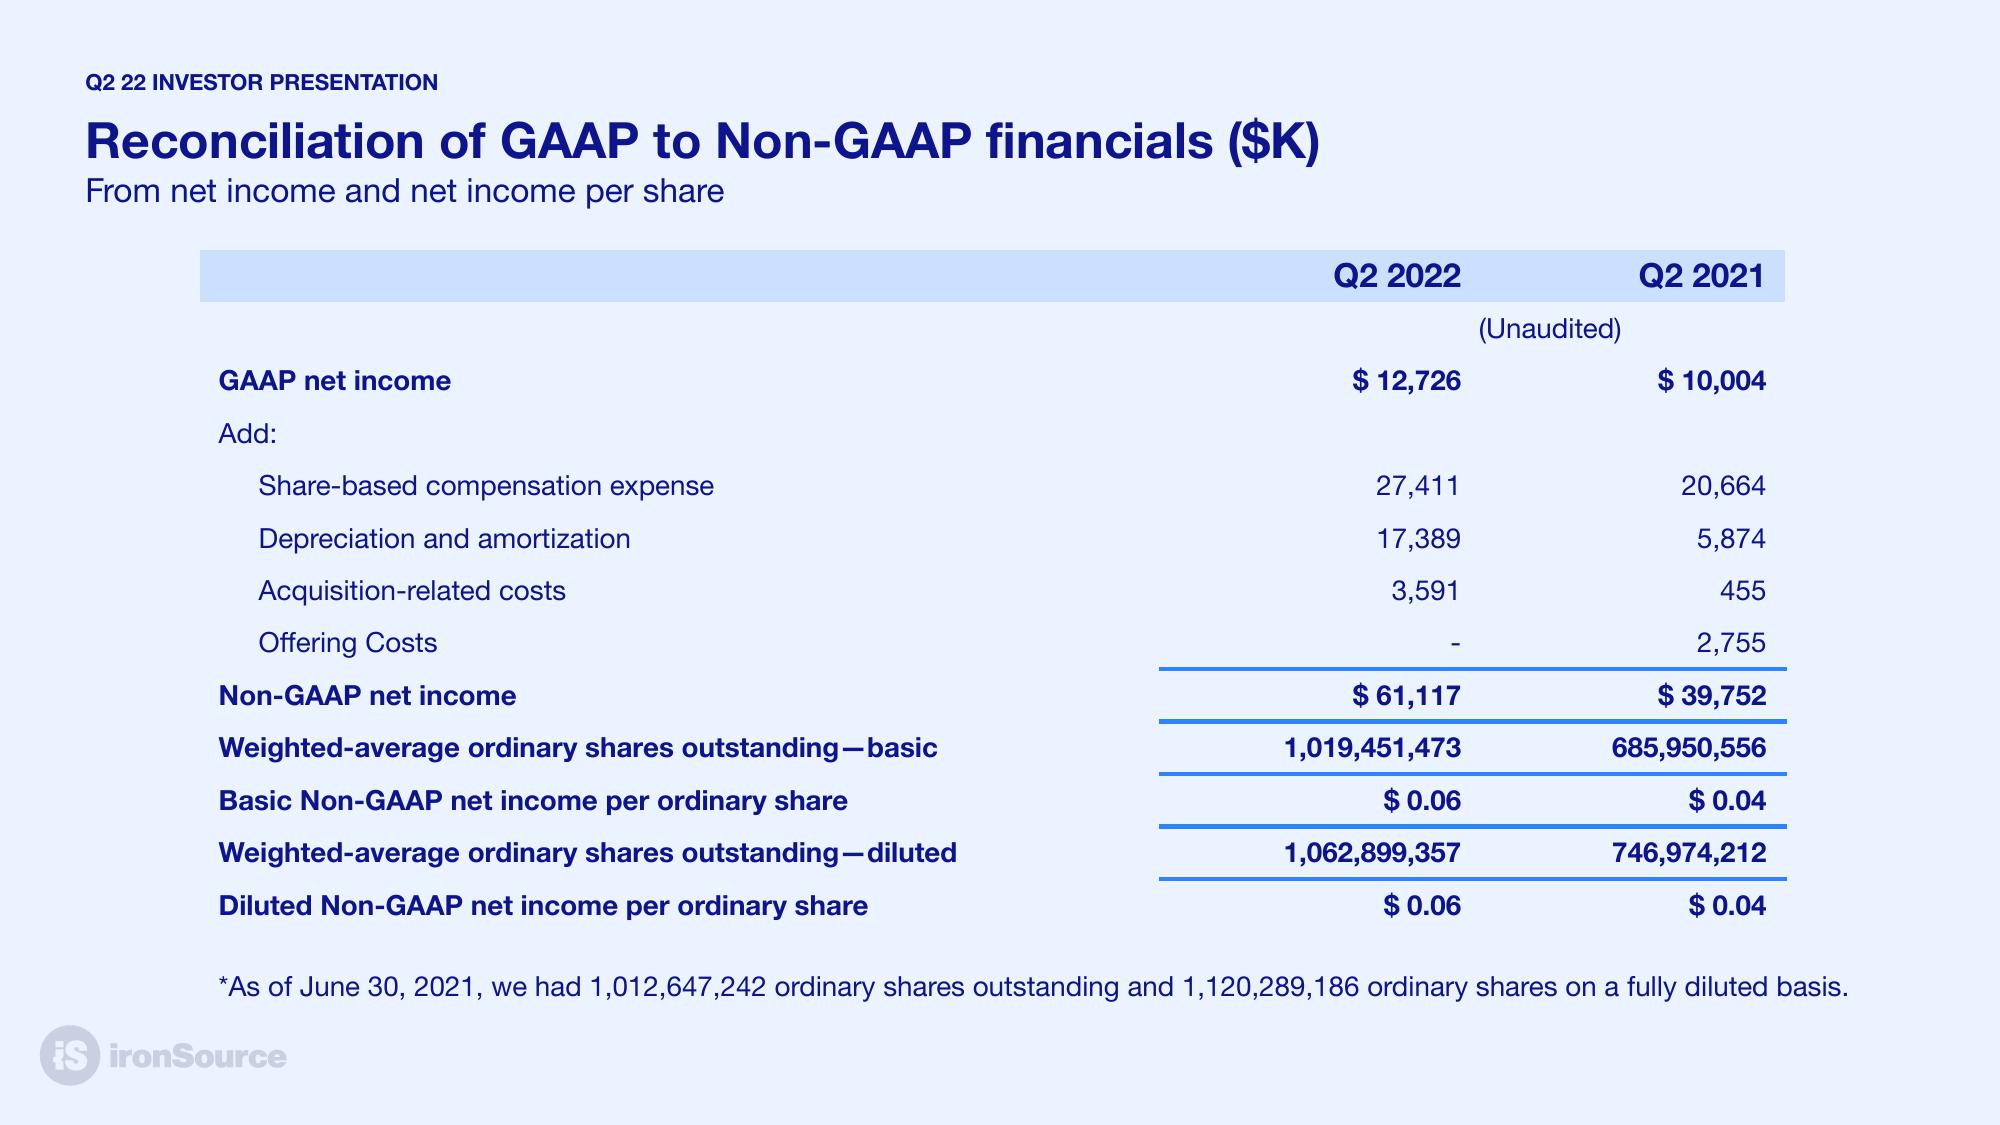
Reconciliation of GAAP to Non-GAAP financials ($K)
From net income and net income per share
GAAP net income
Add:
Share-based compensation expense
Depreciation and amortization
Acquisition-related costs
Offering Costs
Non-GAAP net income
Weighted-average ordinary shares outstanding-basic
Basic Non-GAAP net income per ordinary share
Weighted-average ordinary shares outstanding-diluted
Diluted Non-GAAP net income per ordinary share
Q2 2022
IS ironSource
$ 12,726
27,411
17,389
3,591
$61,117
1,019,451,473
$0.06
1,062,899,357
$0.06
(Unaudited)
Q2 2021
$ 10,004
20,664
5,874
455
2,755
$ 39,752
685,950,556
$ 0.04
746,974,212
$ 0.04
*As of June 30, 2021, we had 1,012,647,242 ordinary shares outstanding and 1,120,289,186 ordinary shares on a fully diluted basis.View entire presentation