Bird Investor Presentation Deck
Outlook - profitability goals update
M
$
BIRD
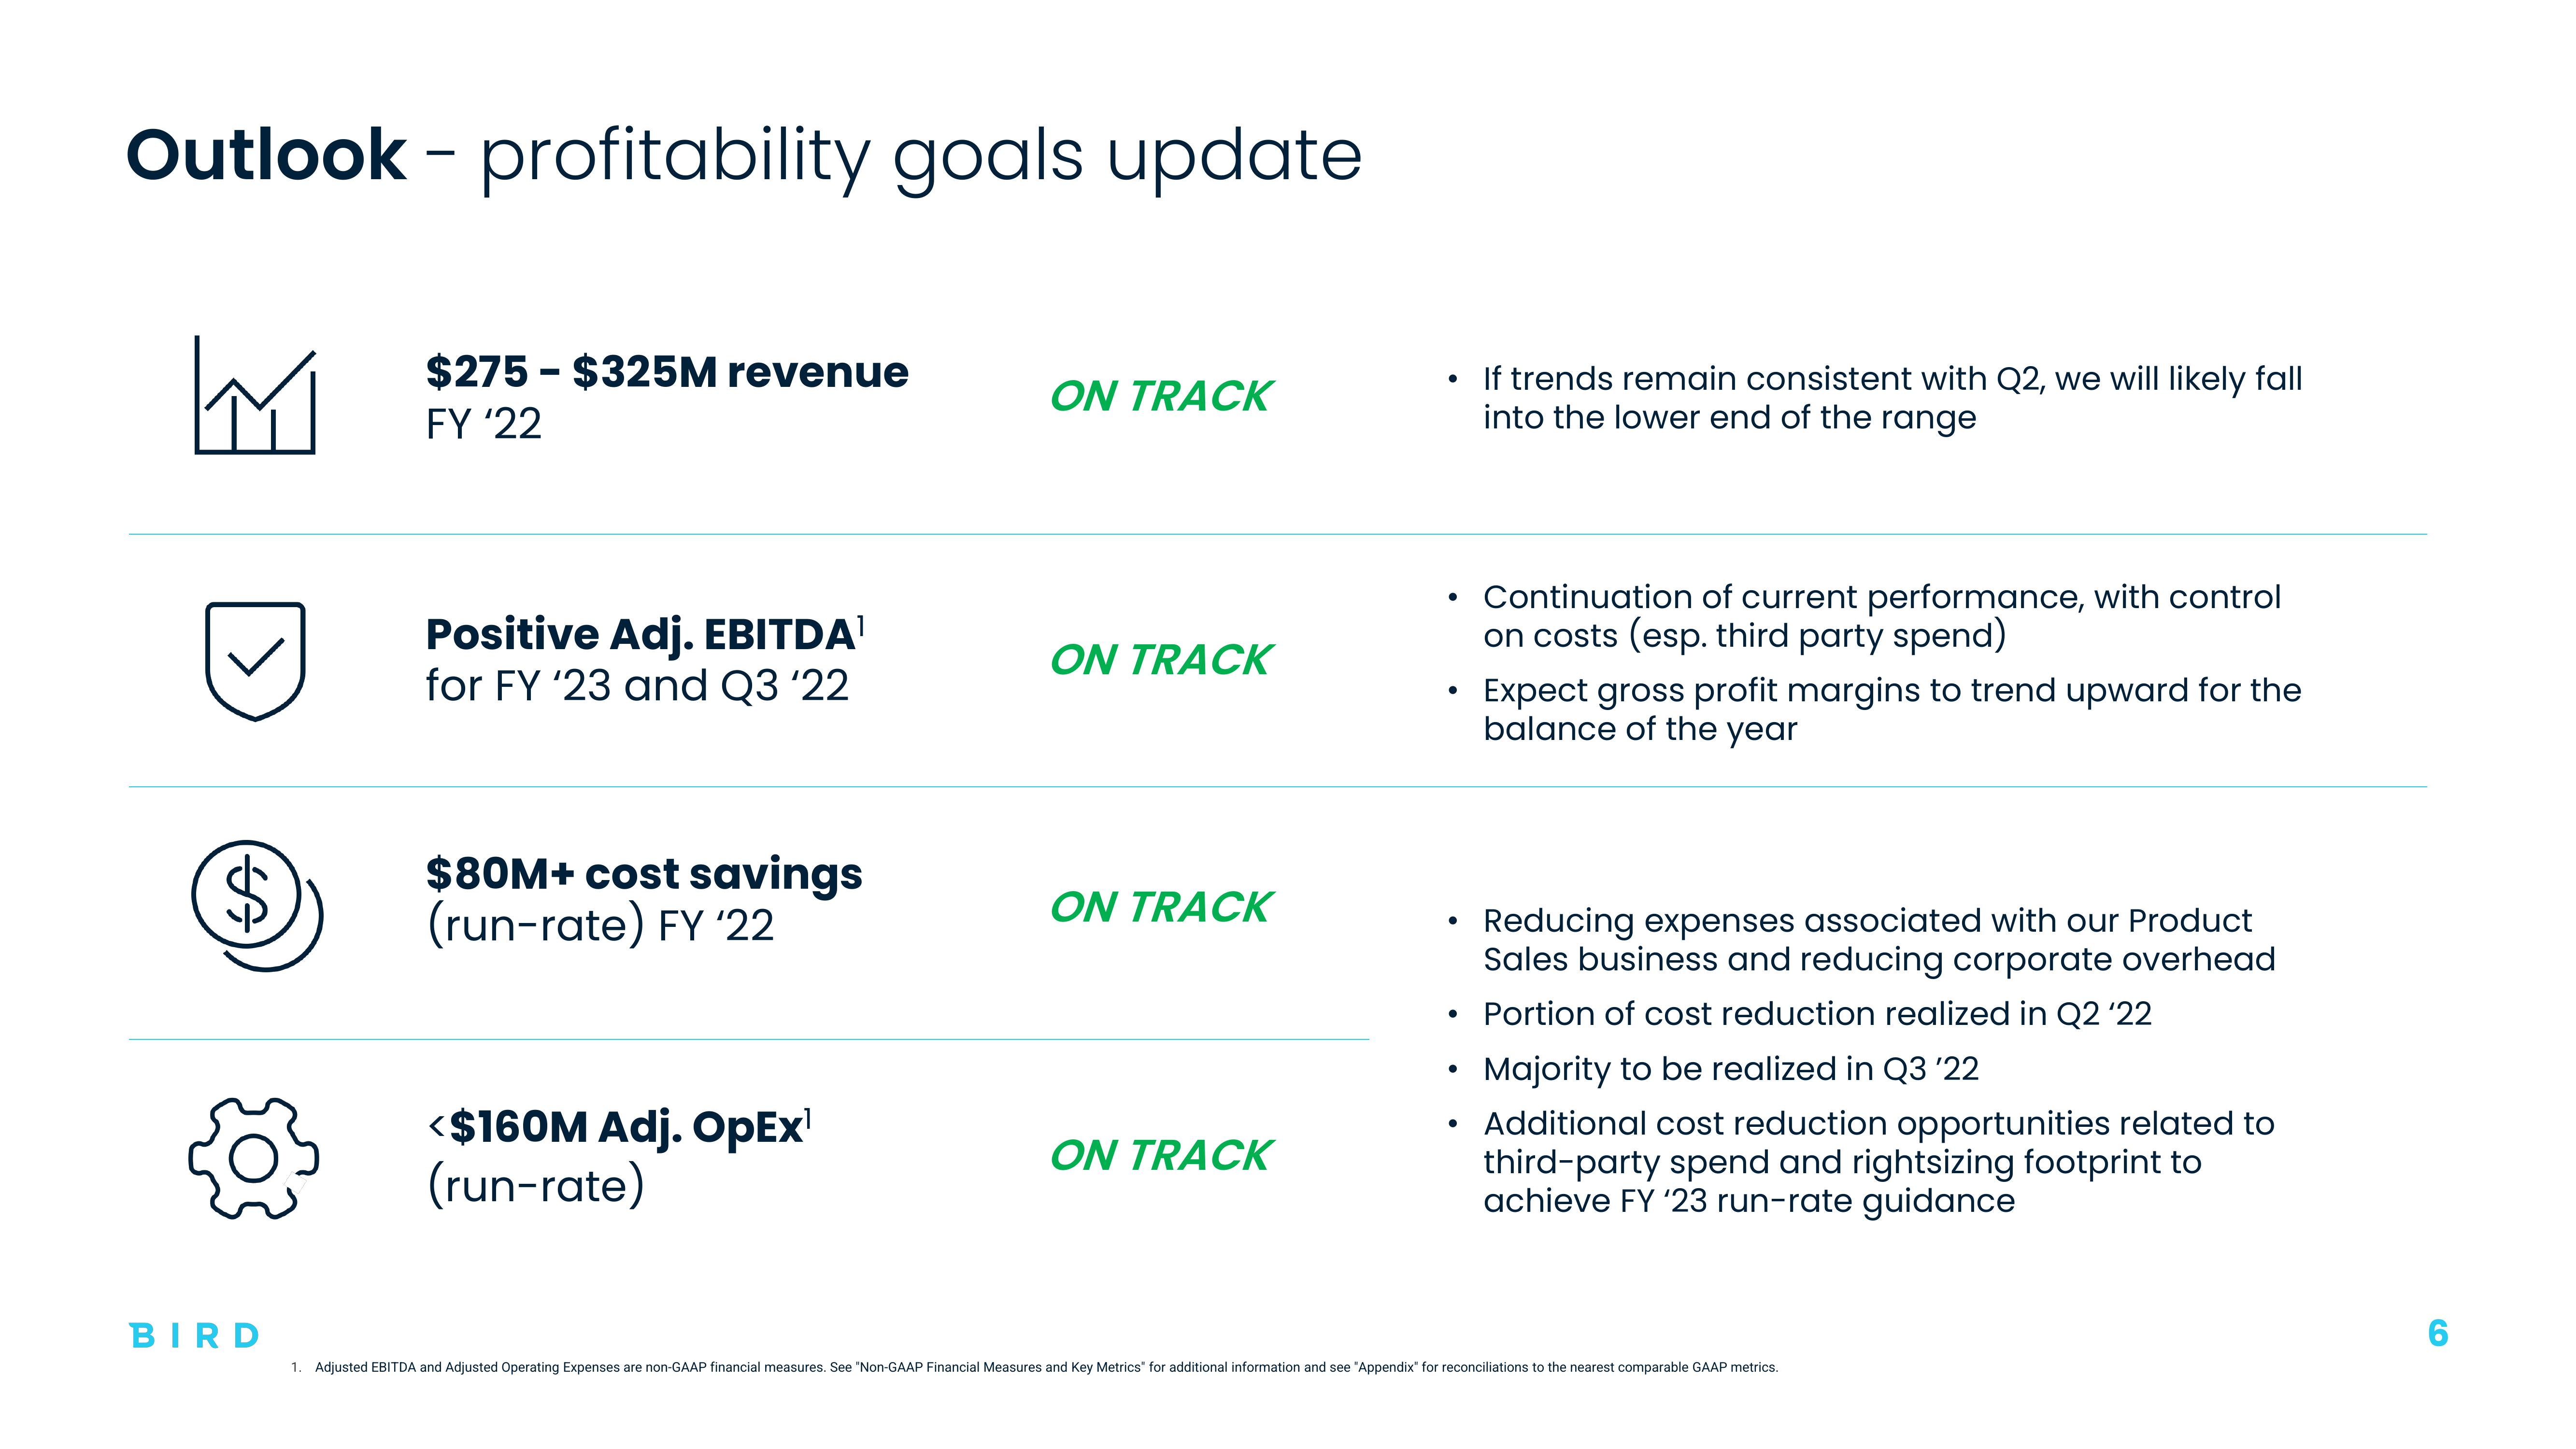
$275- $325M revenue
FY '22
Positive Adj. EBITDA¹
for FY '23 and Q3 '22
$80M+ cost savings
(run-rate) FY '22
<$160M Adj. OpEx¹
(run-rate)
ON TRACK
ON TRACK
ON TRACK
ON TRACK
●
●
●
●
If trends remain consistent with Q2, we will likely fall
into the lower end of the range
inuation current performance, with control
on costs (esp. third party spend)
Expect gross profit margins to trend upward for the
balance of the year
Reducing expenses associated with our Product
Sales business and reducing corporate overhead
Portion of cost reduction realized in Q2 '22
Majority to be realized in Q3 '22
Additional cost reduction opportunities related to
third-party spend and rightsizing footprint to
achieve FY '23 run-rate guidance
1. Adjusted EBITDA and Adjusted Operating Expenses are non-GAAP financial measures. See "Non-GAAP Financial Measures and Key Metrics for additional information and see "Appendix" for reconciliations to the nearest comparable GAAP metrics.View entire presentation