Vale Investor Presentation Deck
17
Vale S.A. Proxy Season 2022
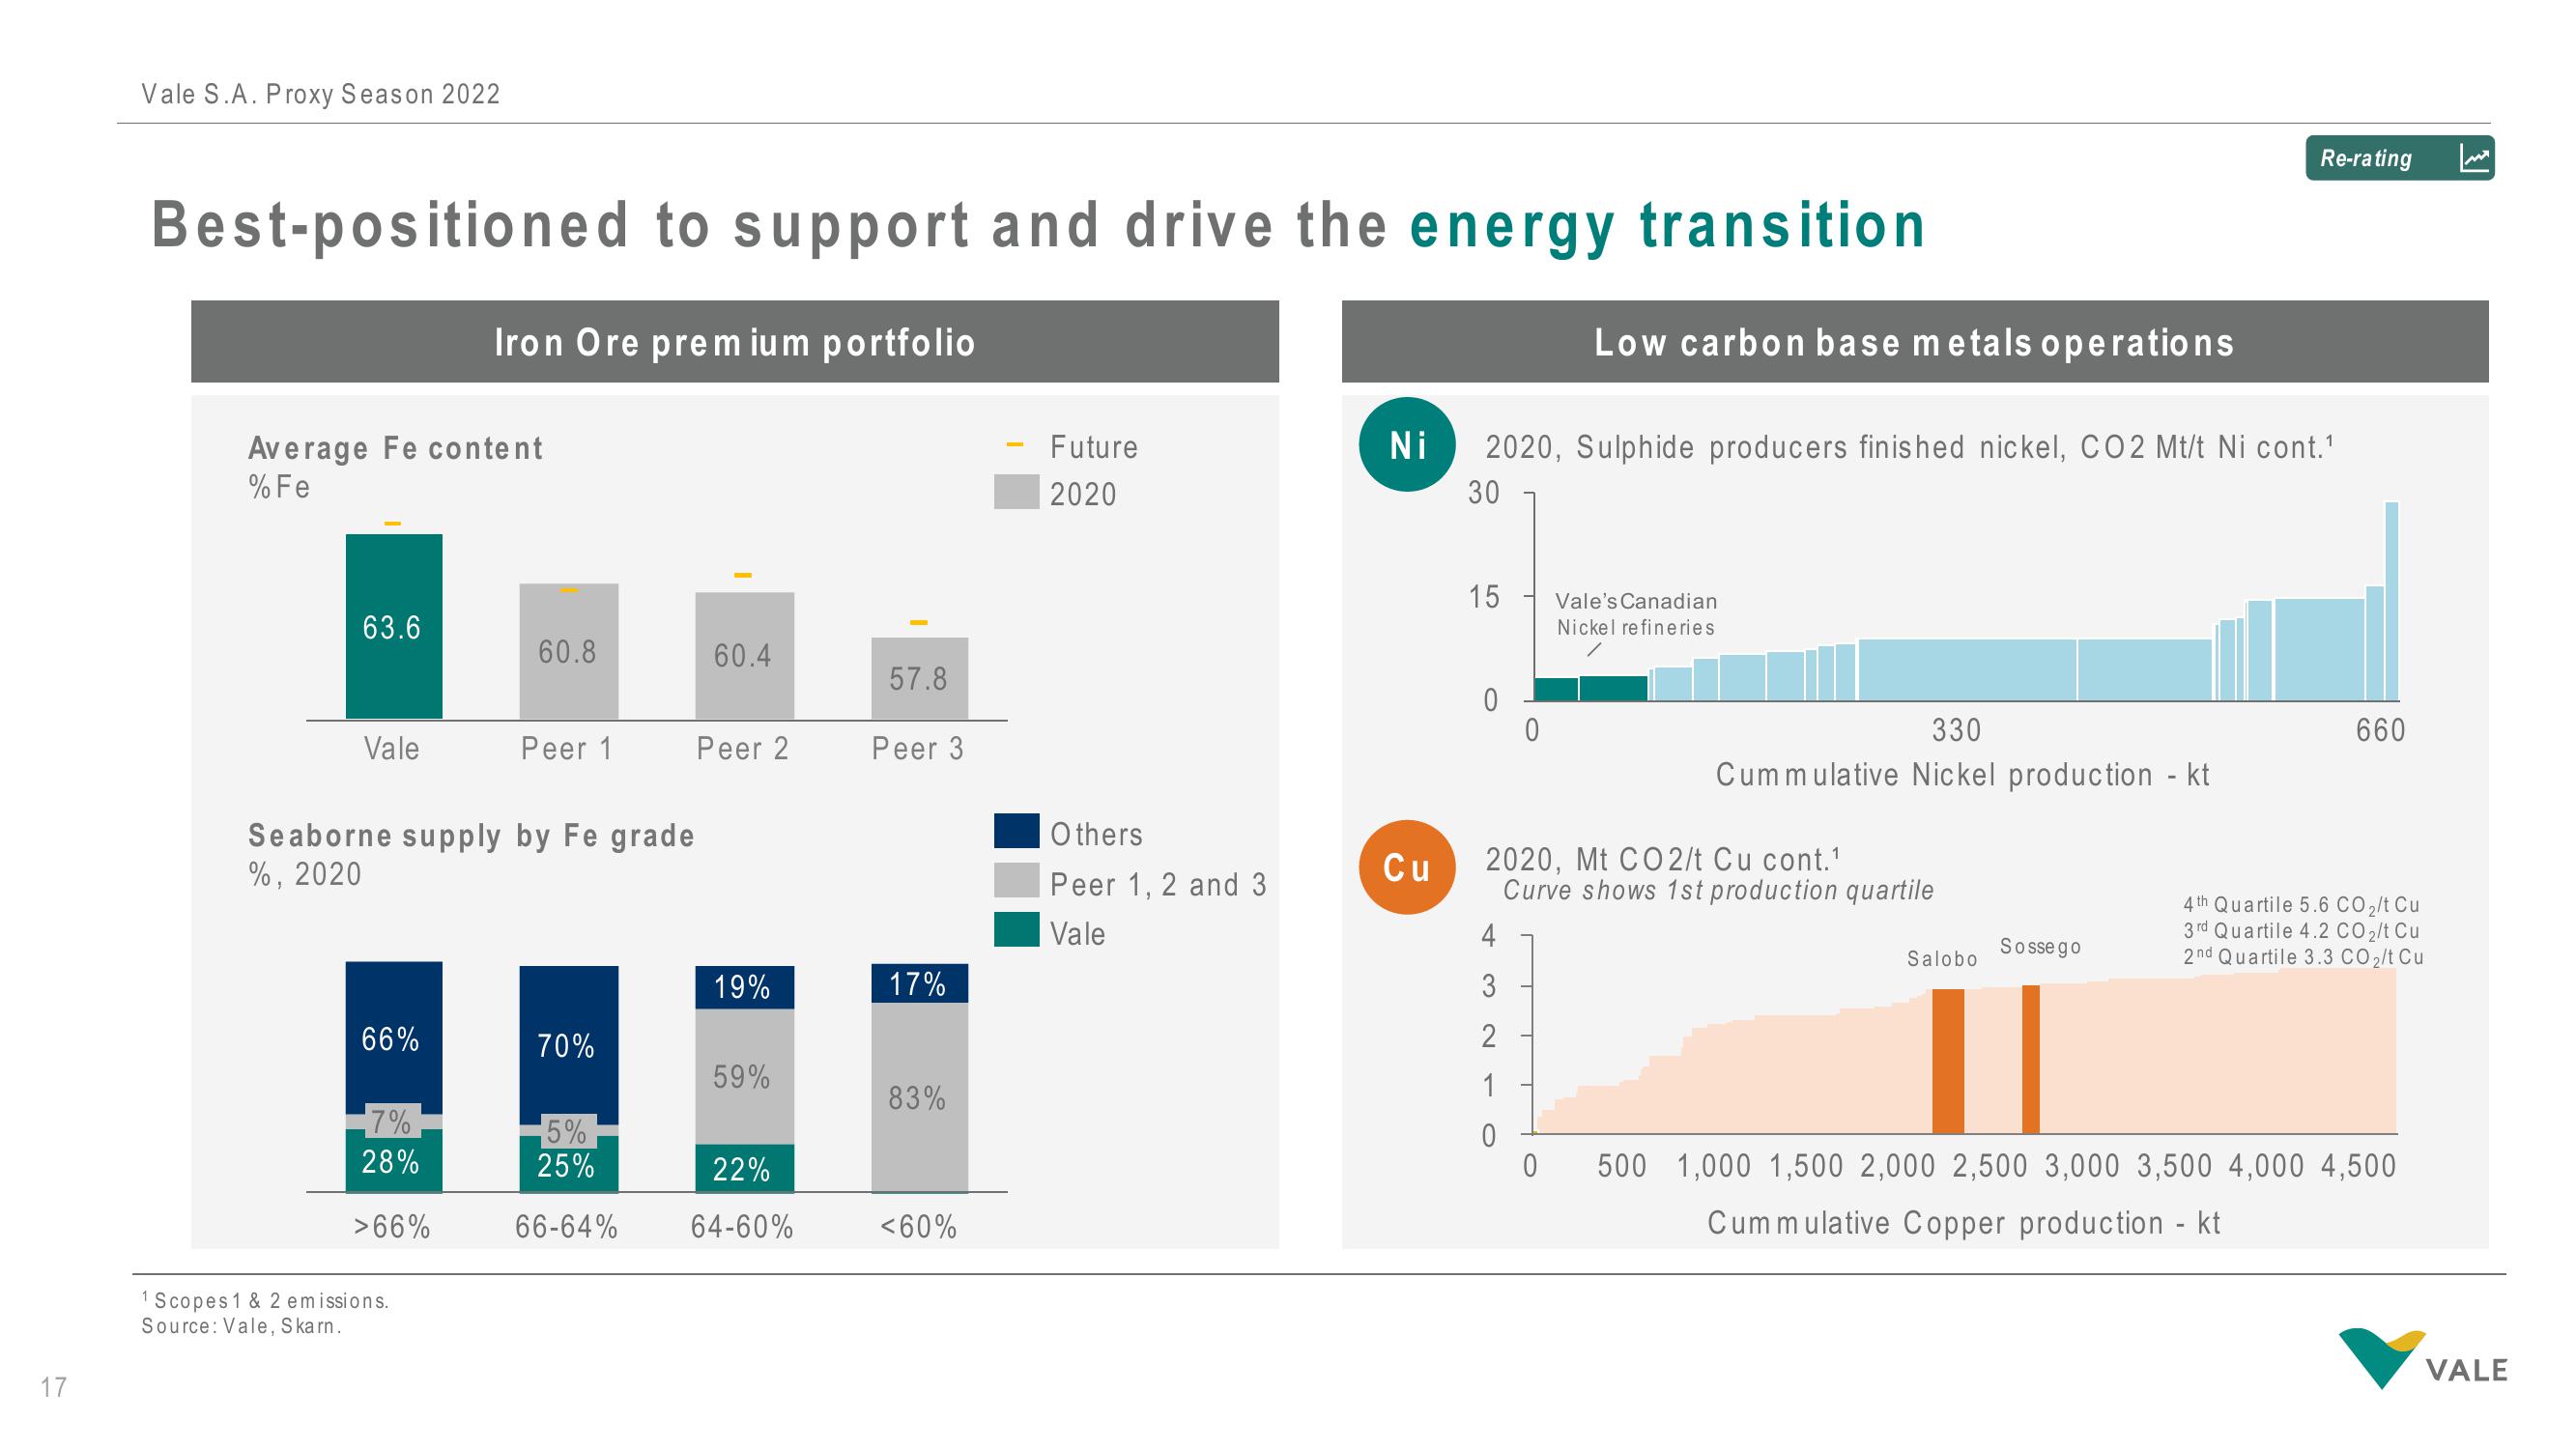
Best-positioned to support and drive the energy transition
Iron Ore premium portfolio
Average Fe content
% Fe
63.6
Vale
66%
Seaborne supply by Fe grade
%, 2020
7%
28%
>66%
60.8
1 Scopes 1 & 2 emissions.
Source: Vale, Skarn.
Peer 1
70%
5%
25%
66-64%
60.4
Peer 2
19%
59%
22%
64-60%
57.8
Peer 3
17%
83%
<60%
Future
2020
Others
Peer 1, 2 and 3
Vale
Cu
Ni 2020, Sulphide producers finished nickel, CO2 Mt/t Ni cont.¹
30
15
0
4
0
3
2
1
0
Low carbon base metals operations
2020, Mt CO2/t Cu cont.¹
Curve shows 1st production quartile
0
Vale's Canadian
Nickel refineries.
330
Cummulative Nickel production - kt
Salobo
Re-rating
Sossego
660
4th Quartile 5.6 CO₂/t Cu
3rd Quartile 4.2 CO₂/t Cu
2nd Quartile 3.3 CO ₂/t Cu
500 1,000 1,500 2,000 2,500 3,000 3,500 4,000 4,500
Cum mulative Copper production - kt
VALEView entire presentation