Liberty Global Results Presentation Deck
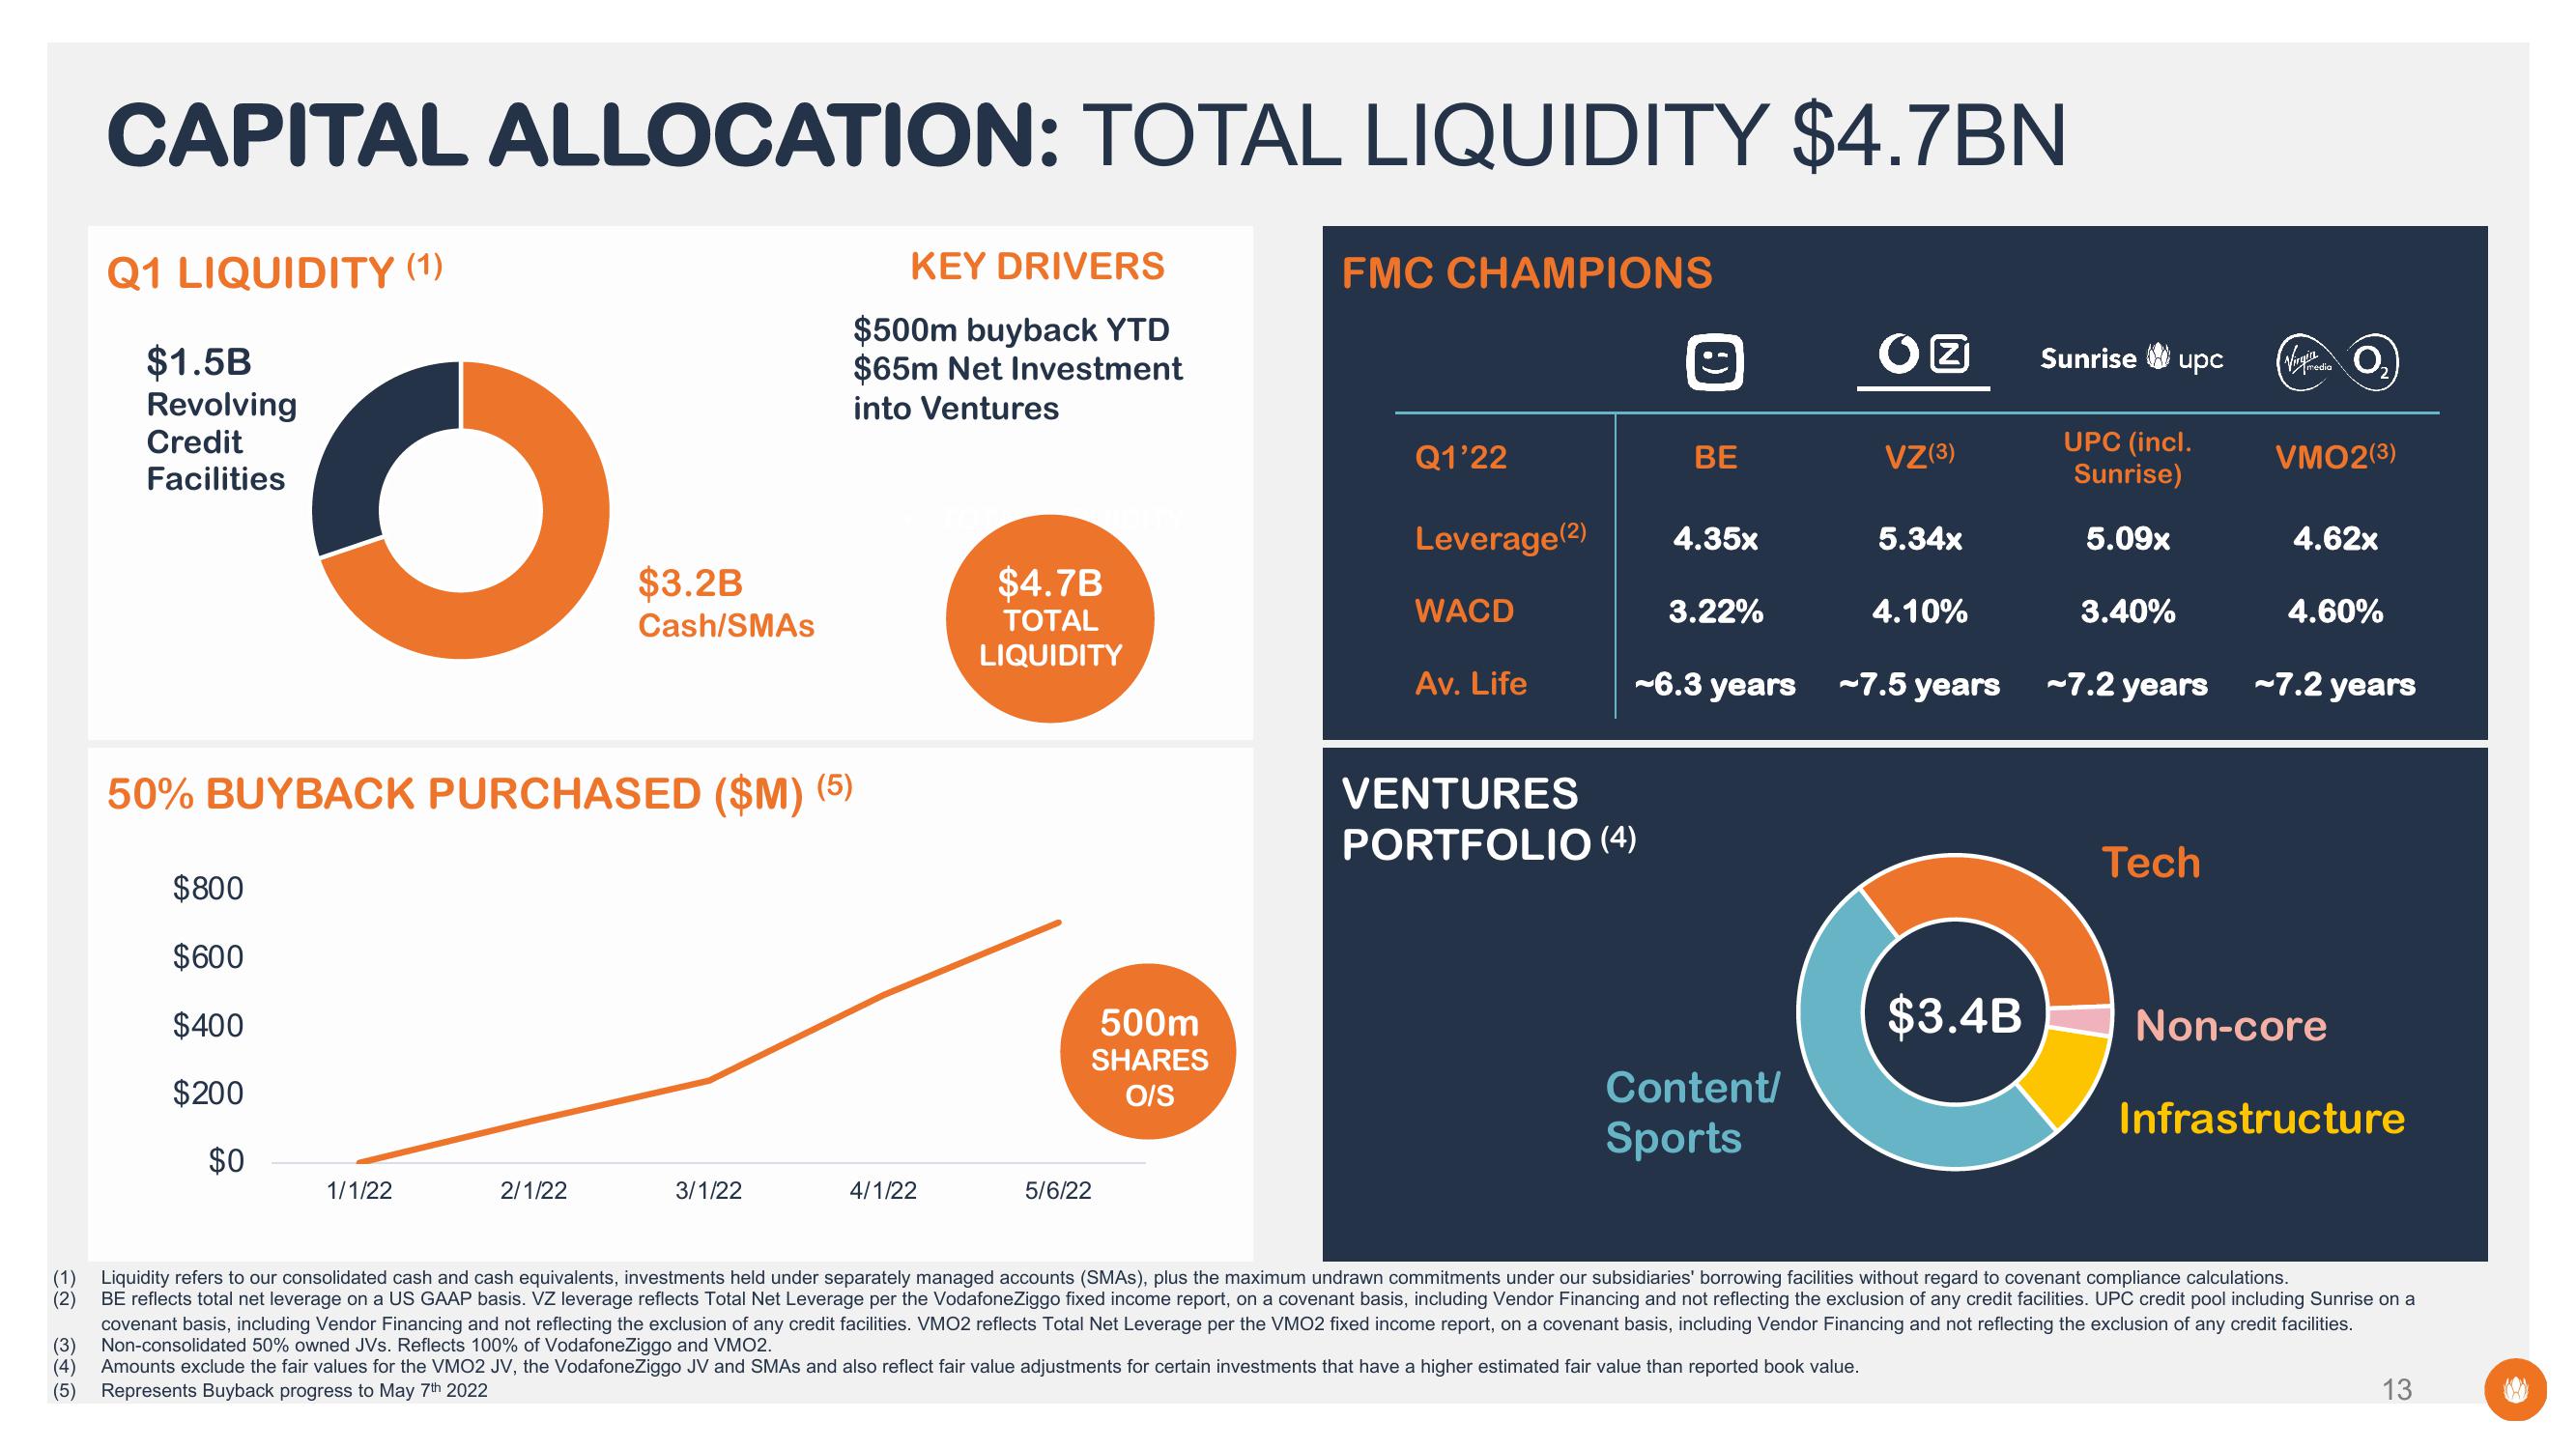
CAPITAL ALLOCATION: TOTAL LIQUIDITY $4.7BN
Q1 LIQUIDITY (1)
$1.5B
Revolving
Credit
Facilities
O
$800
$600
$400
$200
$0
50% BUYBACK PURCHASED ($M) (5)
1/1/22
$3.2B
Cash/SMAS
2/1/22
KEY DRIVERS
$500m buyback YTD
$65m Net Investment
into Ventures
3/1/22
4/1/22
$4.7B
TOTAL
LIQUIDITY
500m
SHARES
O/S
5/6/22
FMC CHAMPIONS
Q1'22
Leverage (2)
WACD
Av. Life
BE
VENTURES
PORTFOLIO (4)
4.35x
3.22%
-6.3 years
Content/
Sports
O
VZ(3)
5.34x
4.10%
-7.5 years
$3.4B
Sunrise
upc
UPC (incl.
Sunrise)
5.09x
3.40%
-7.2 years
Tech
(Verygtedi 0₂
media
VMO2(3)
4.62x
4.60%
-7.2 years
Non-core
Infrastructure
(1) Liquidity refers to our consolidated cash and cash equivalents, investments held under separately managed accounts (SMAs), plus the maximum undrawn commitments under our subsidiaries' borrowing facilities without regard to covenant compliance calculations.
(2) BE reflects total net leverage on a US GAAP basis. VZ leverage reflects Total Net Leverage per the VodafoneZiggo fixed income report, on a covenant basis, including Vendor Financing and not reflecting the exclusion of any credit facilities. UPC credit pool including Sunrise on a
covenant basis, including Vendor Financing and not reflecting the exclusion of any credit facilities. VMO2 reflects Total Net Leverage per the VMO2 fixed income report, on a covenant basis, including Vendor Financing and not reflecting the exclusion of any credit facilities.
(3) Non-consolidated 50% owned JVs. Reflects 100% of VodafoneZiggo and VMO2.
(4) Amounts exclude the fair values for the VMO2 JV, the VodafoneZiggo JV and SMAS and also reflect fair value adjustments for certain investments that have a higher estimated fair value than reported book value.
(5) Represents Buyback progress to May 7th 2022
13View entire presentation