Marten Transport Results Presentation Deck slide image

Marten Transport Results Presentation Deck

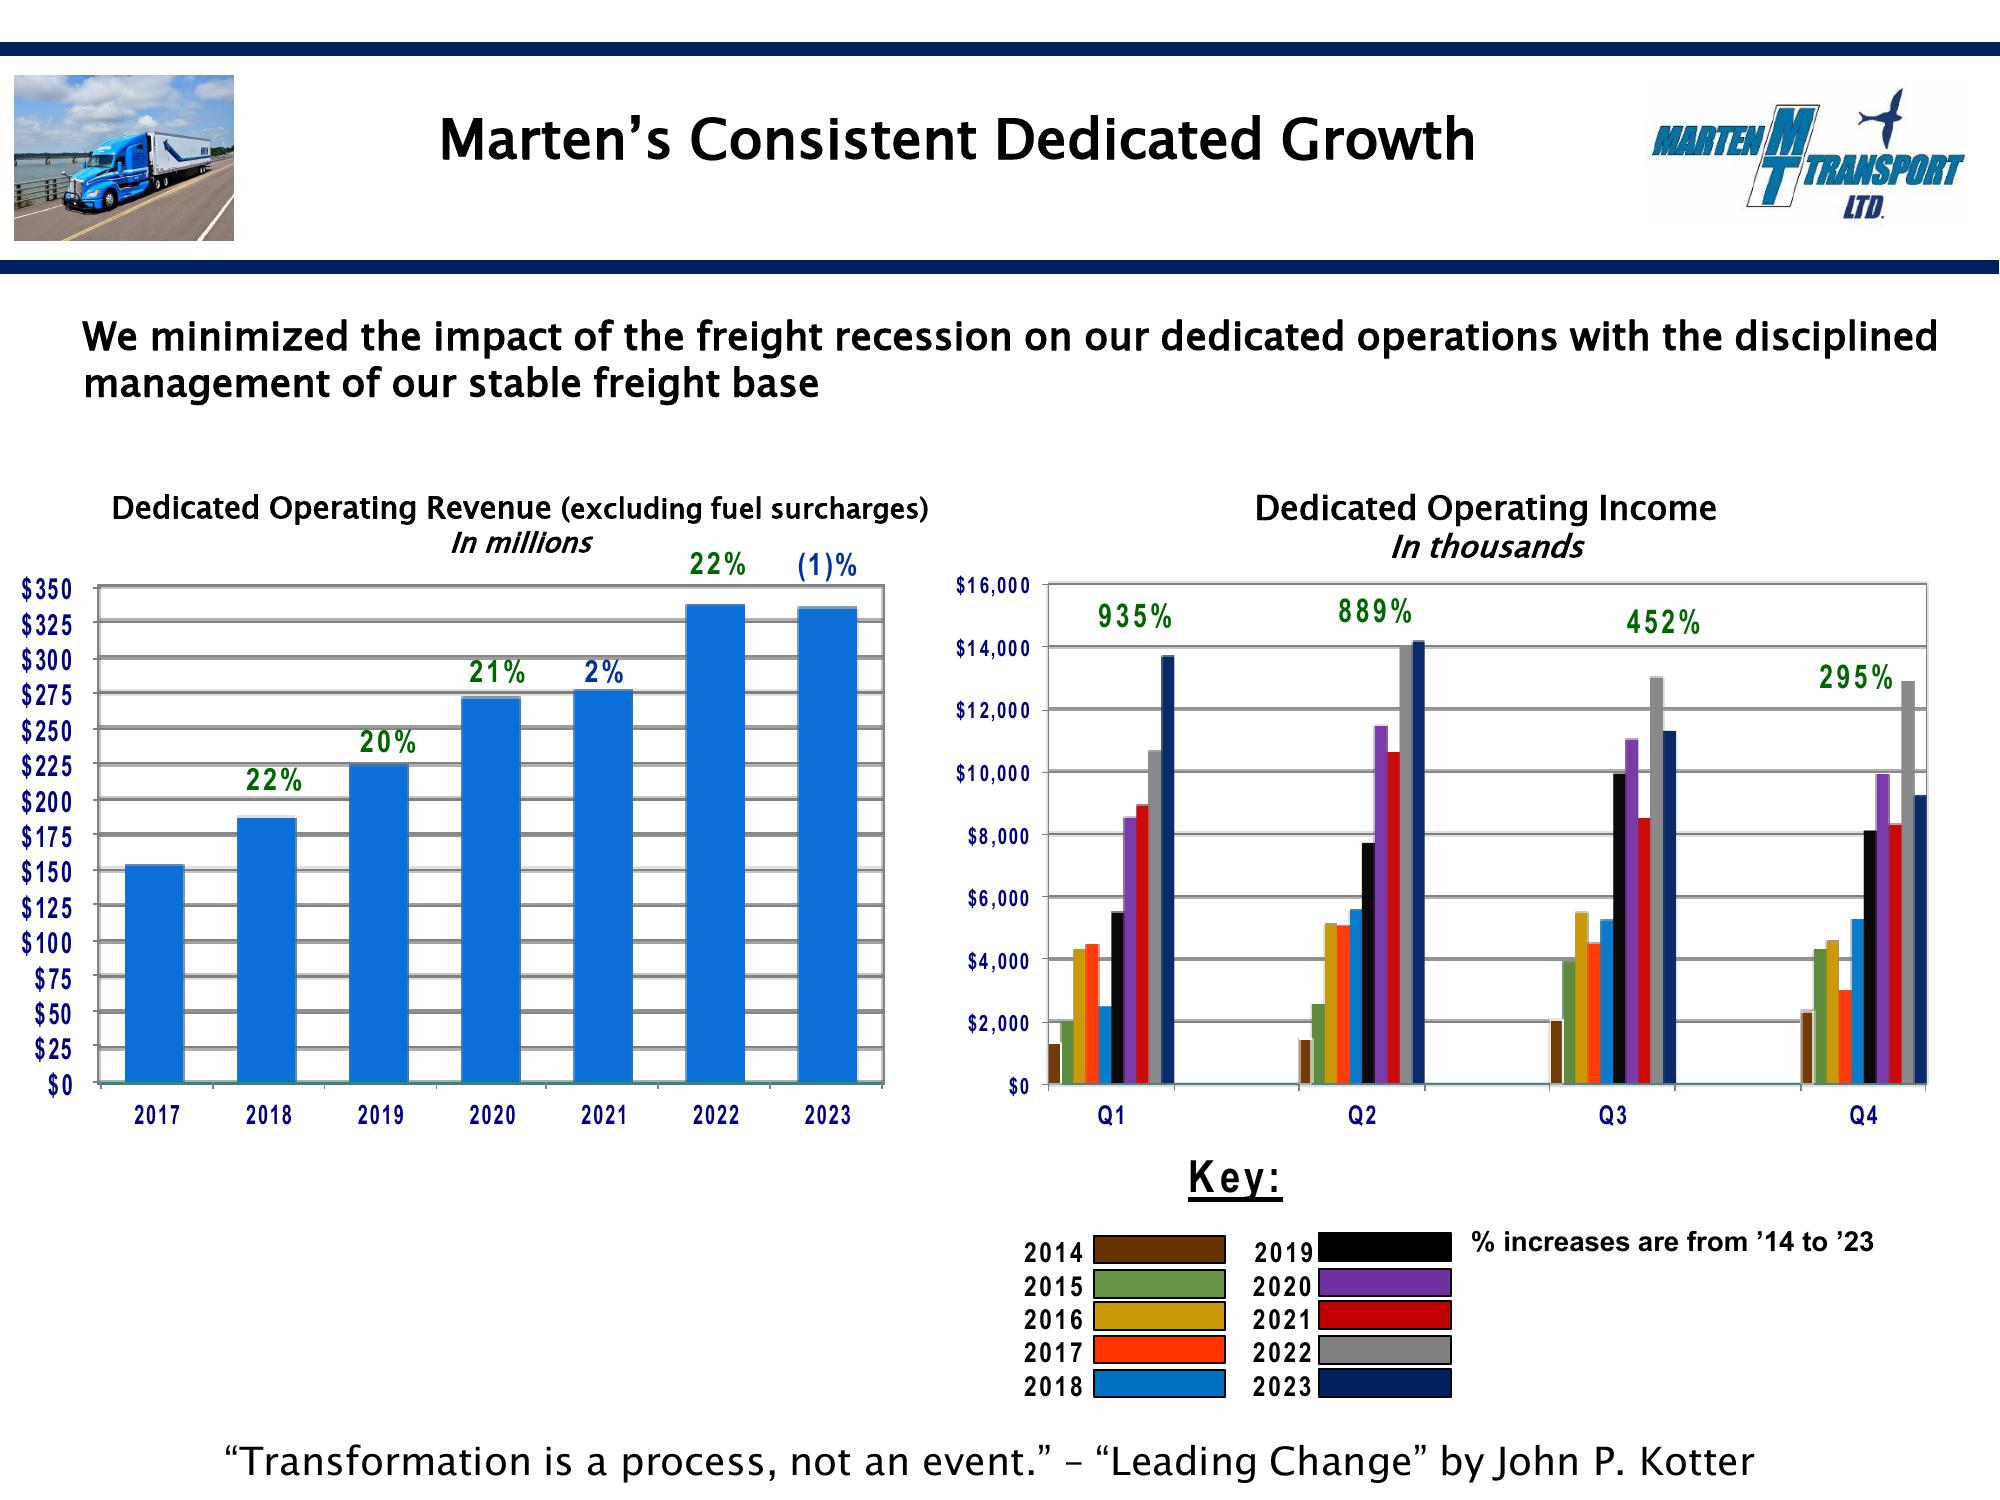
$350 $325 $300 $275 $250 $225 $200 $175 $150 $125 $100 $75 $50 $25 $0 We minimized the impact of the freight recession on our dedicated operations with the disciplined management of our stable freight base Dedicated Operating Revenue (excluding fuel surcharges) In millions 22% (1)% 2017 22% 2018 Marten's Consistent Dedicated Growth 20% 2019 21% 2% 2020 2021 2022 2023 $16,000 $14,000 $12,000 $10,000 $8,000 $6,000 $4,000 $2,000 $0 2014 2015 2016 2017 2018 935% Q1 Dedicated Operating Income In thousands Key: 2019 2020 2021 2022 2023 889% MARTENM + TTRANSPORT LTD. Q2 452% Q3 295% "Transformation is a process, not an event." - "Leading Change" by John P. Kotter Q4 % increases are from '14 to '23
View entire presentation