Avantor Results Presentation Deck
1
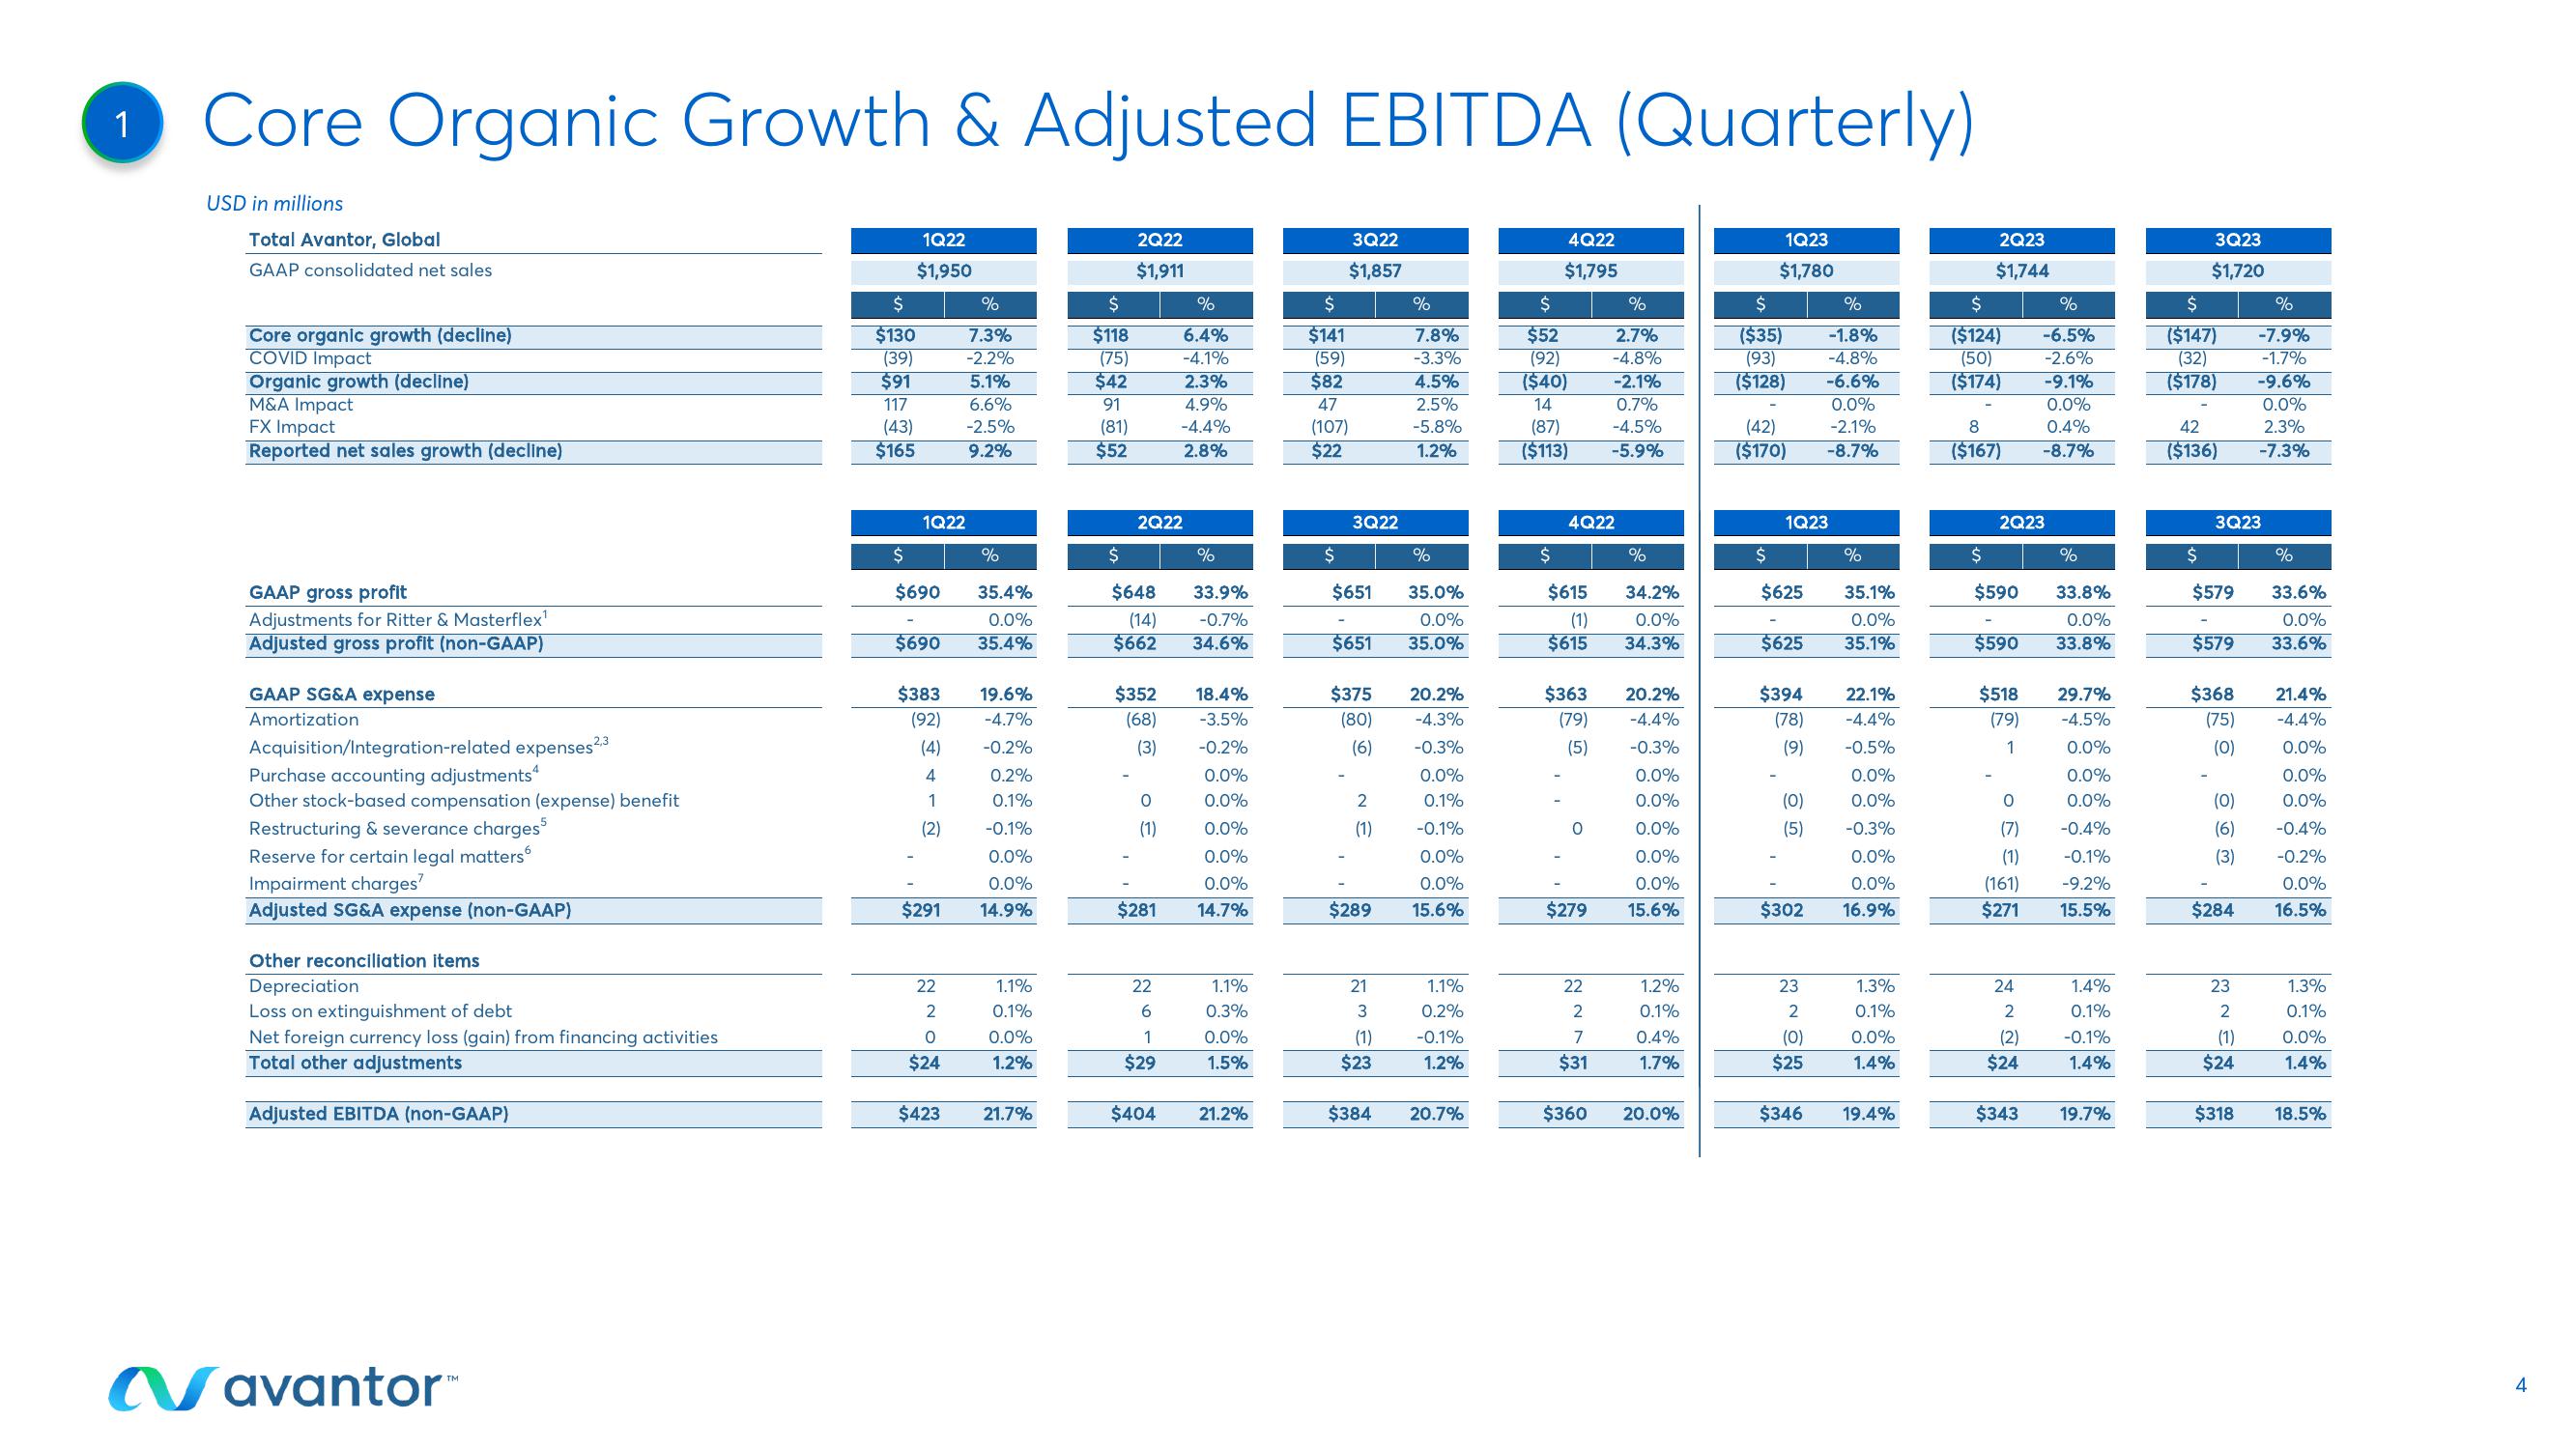
Core Organic Growth & Adjusted EBITDA (Quarterly)
USD in millions
Total Avantor, Global
GAAP consolidated net sales
Core organic growth (decline)
COVID Impact
Organic growth (decline)
M&A Impact
FX Impact
Reported net sales growth (decline)
GAAP gross profit
Adjustments for Ritter & Masterflex¹
Adjusted gross profit (non-GAAP)
GAAP SG&A expense
Amortization
Acquisition/Integration-related expenses?
Purchase accounting adjustments
Other stock-based compensation (expense) benefit
Restructuring & severance charges
Reserve for certain legal matters
Impairment charges?
Adjusted SG&A expense (non-GAAP)
2,3
Other reconciliation items
Depreciation
Loss on extinguishment of debt
Net foreign currency loss (gain) from financing activities
Total other adjustments
Adjusted EBITDA (non-GAAP)
Navantor™
1Q22
$1,950
$
$130
(39)
$91
117
(43)
$165
1Q22
$
$690
$690
$383
(92)
(4)
4
1
(2)
$291
22
2
0
$24
%
7.3%
-2.2%
5.1%
6.6%
-2.5%
9.2%
$423
%
35.4%
0.0%
35.4%
19.6%
-4.7%
-0.2%
0.2%
0.1%
-0.1%
0.0%
0.0%
14.9%
1.1%
0.1%
0.0%
1.2%
21.7%
$
$118
(75)
$42
91
(81)
$52
2Q22
$1,911
2Q22
$
$648
(14)
$662
0
(1)
%
6.4%
-4.1%
2.3%
4.9%
-4.4%
2.8%
$281
$352 18.4%
(68) -3.5%
(3)
-0.2%
0.0%
0.0%
0.0%
0.0%
0.0%
14.7%
22
6
1
$29
%
33.9%
-0.7%
34.6%
1.1%
0.3%
0.0%
1.5%
$404 21.2%
3Q22
$1,857
$
$141
(59)
$82
47
(107)
$22
3Q22
$
$651
%
7.8%
-3.3%
4.5%
2.5%
-5.8%
1.2%
35.0%
0.0%
$651 35.0%
2
(1)
%
$375 20.2%
(80) -4.3%
(6) -0.3%
0.0%
0.1%
21
3
(1)
$23
-0.1%
0.0%
0.0%
$289 15.6%
1.1%
0.2%
-0.1%
1.2%
$384 20.7%
4Q22
$1,795
$
%
$52 2.7%
(92) -4.8%
($40) -2.1%
14
0.7%
(87) -4.5%
($113) -5.9%
4Q22
$
$615
(1)
$615
$363
(79)
(5)
0
$279
22
2
7
$31
$360
%
34.2%
0.0%
34.3%
20.2%
-4.4%
-0.3%
0.0%
0.0%
0.0%
0.0%
0.0%
15.6%
1.2%
0.1%
0.4%
1.7%
20.0%
1Q23
$1,780
$
%
($35) -1.8%
(93) -4.8%
($128) -6.6%
0.0%
-2.1%
-8.7%
(42)
($170)
1Q23
$
$625
$625
$394
(78)
(9)
(0)
(5)
$302
23
2
(0)
$25
%
35.1%
0.0%
35.1%
22.1%
-4.4%
-0.5%
0.0%
0.0%
-0.3%
0.0%
0.0%
16.9%
1.3%
0.1%
0.0%
1.4%
$346 19.4%
2Q23
$1,744
%
$
($124) -6.5%
(50) -2.6%
($174) -9.1%
0.0%
0.4%
-8.7%
8
($167)
2Q23
$
$590
33.8%
0.0%
$590 33.8%
$518
(79)
1
0
(7)
(1)
(161)
$271
24
2
(2)
$24
%
$343
29.7%
-4.5%
0.0%
0.0%
0.0%
-0.4%
-0.1%
-9.2%
15.5%
1.4%
0.1%
-0.1%
1.4%
19.7%
3Q23
$1,720
$
%
($147) -7.9%
(32) -1.7%
($178) -9.6%
0.0%
2.3%
42
($136) -7.3%
3Q23
$
$579 33.6%
0.0%
33.6%
$579
$368
(75)
(0)
(0)
(6)
(3)
$284
23
2
(1)
$24
$318
%
21.4%
-4.4%
0.0%
0.0%
0.0%
-0.4%
-0.2%
0.0%
16.5%
1.3%
0.1%
0.0%
1.4%
18.5%
4View entire presentation