Wix Results Presentation Deck
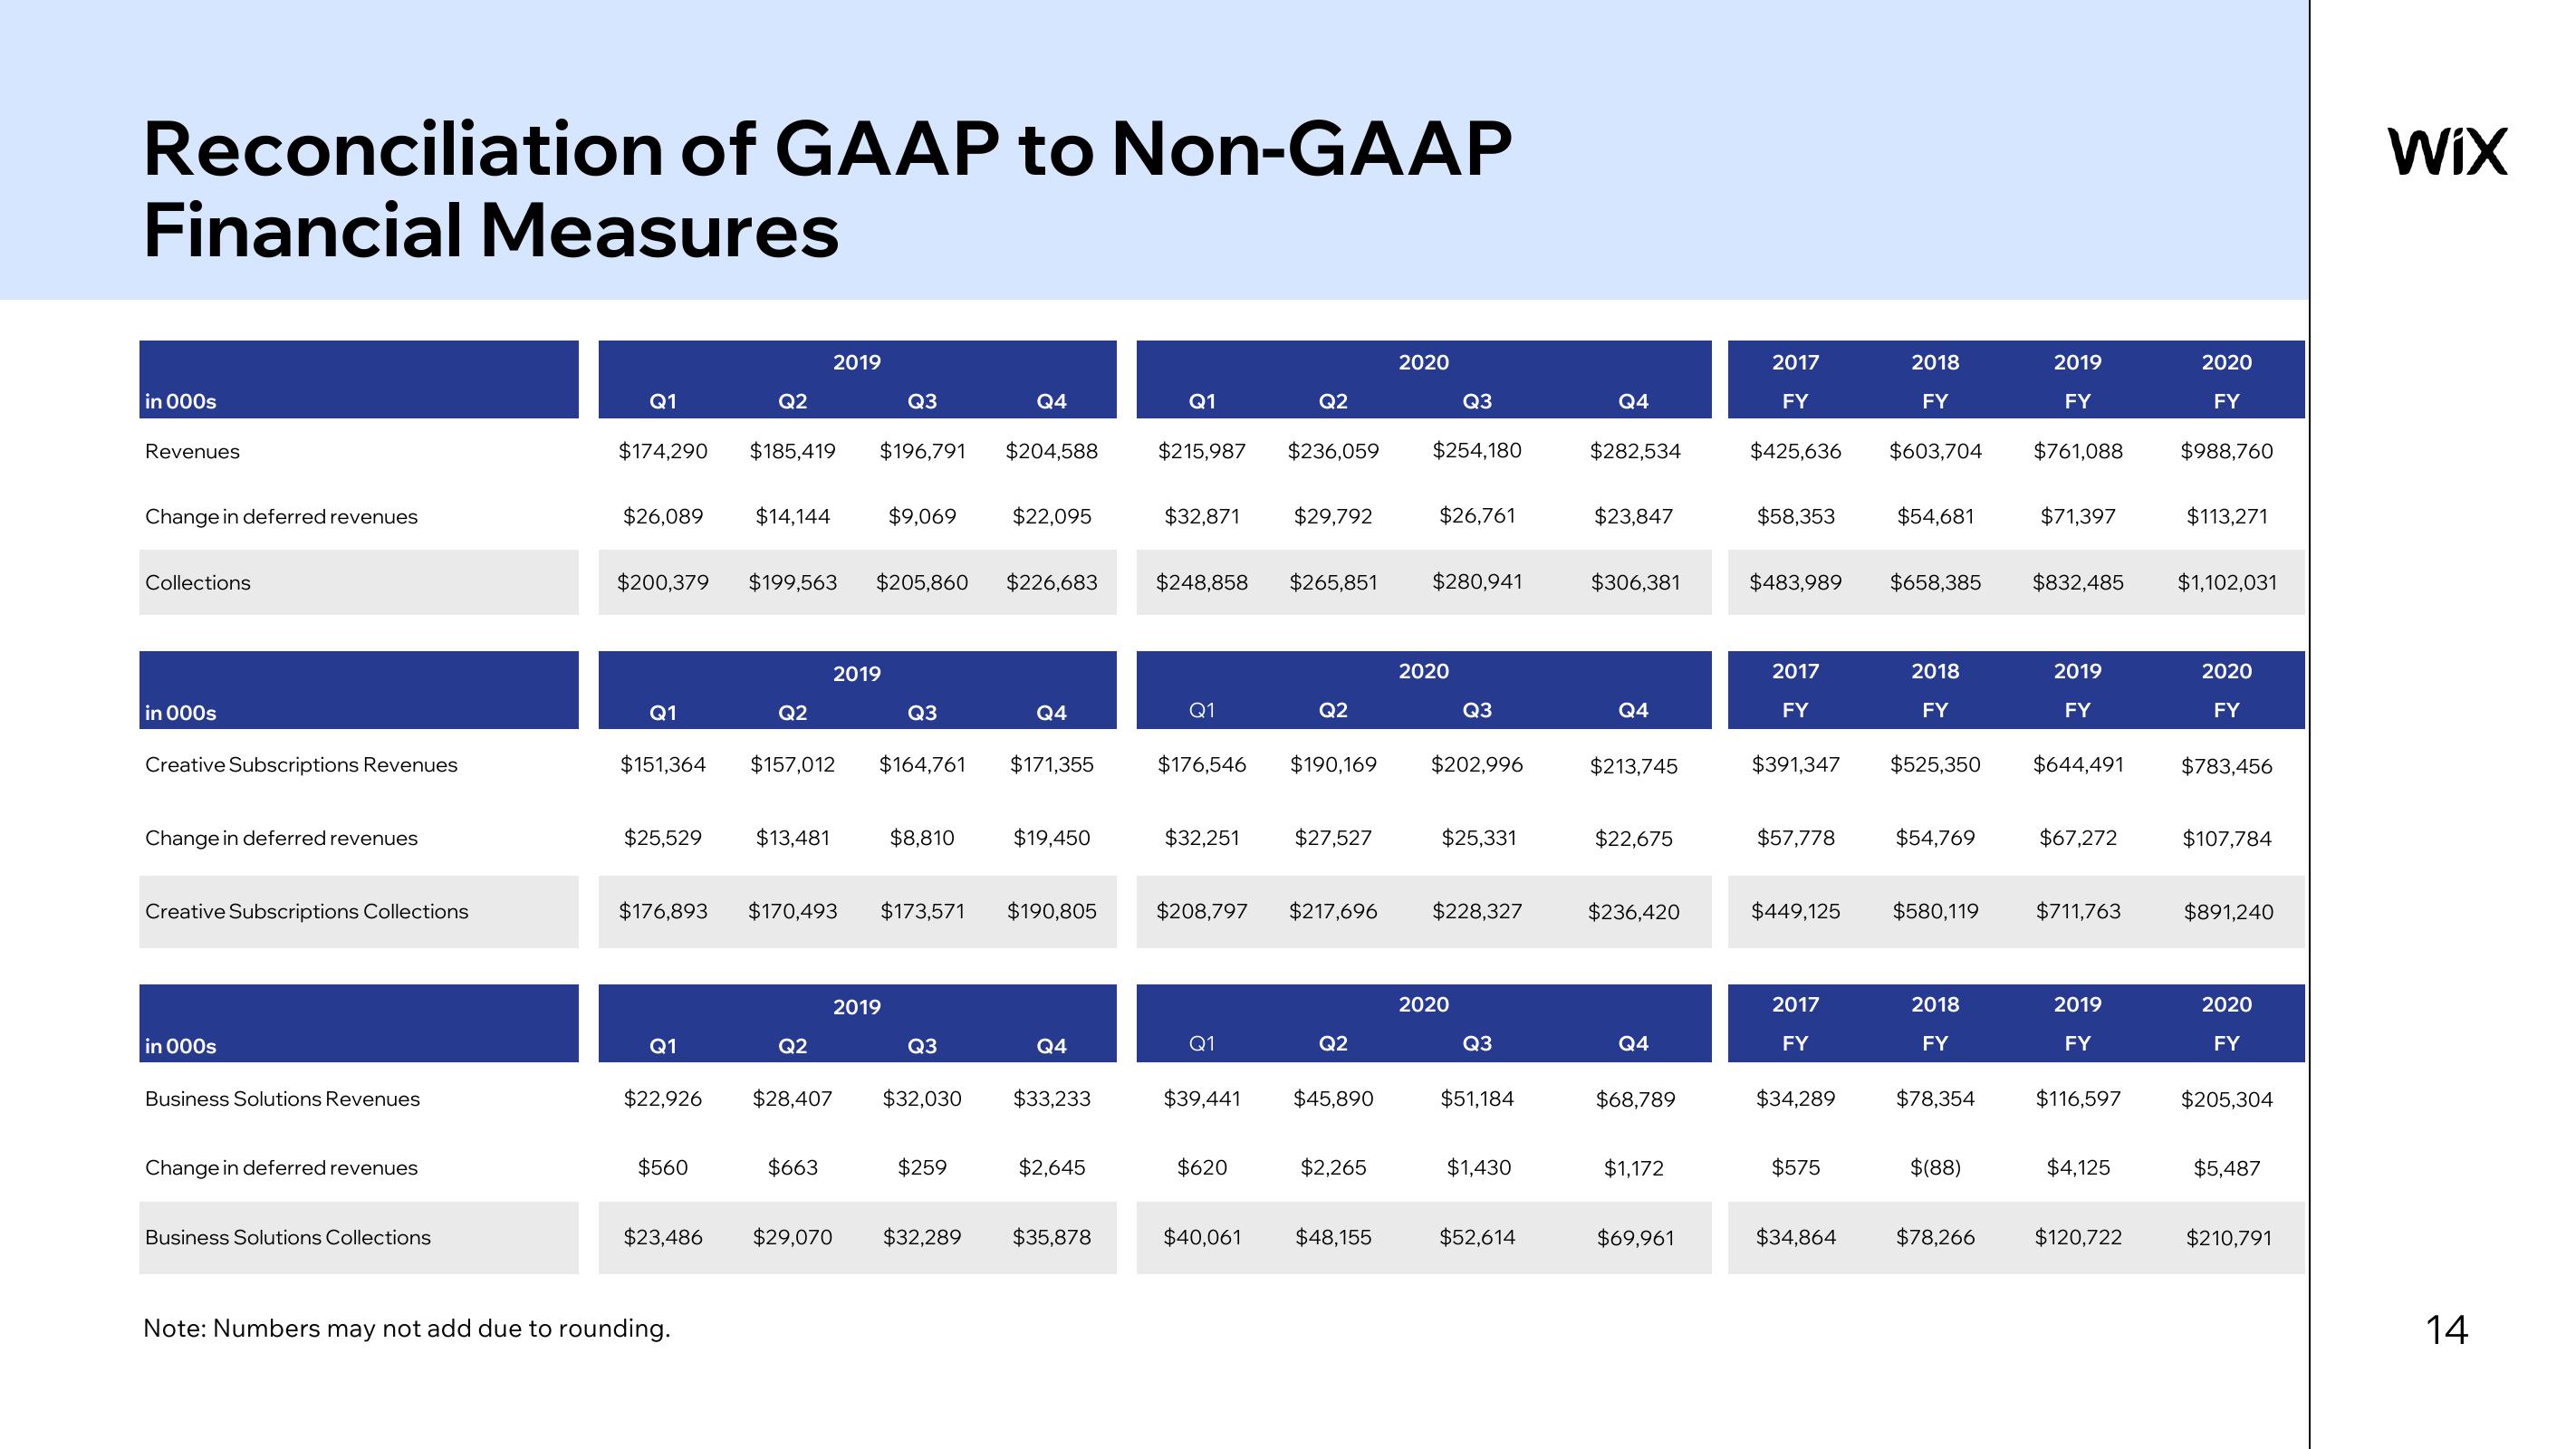
Reconciliation of GAAP to Non-GAAP
Financial Measures
in 000s
Revenues
Change in deferred revenues
Collections
in 000s
Creative Subscriptions Revenues
Change in deferred revenues
Creative Subscriptions Collections
in 000s
Business Solutions Revenues
Change in deferred revenues
Business Solutions Collections
Q1
$174,290
$26,089
Q1
$151,364
$25,529
$176,893
Q1
$200,379 $199,563 $205,860
$22,926
$560
$23,486
Q2
Note: Numbers may not add due to rounding.
$14,144
$185,419 $196,791
Q2
$13,481
2019
Q2
2019
$157,012 $164,761
$663
Q3
$29,070
$28,407
$9,069
$170,493 $173,571
2019
Q3
$8,810
Q3
$32,030
$259
$32,289
Q4
$204,588
$22,095
$226,683
Q4
$171,355
$19,450
$190,805
Q4
$33,233
$2,645
$35,878
Q1
$215,987 $236,059
$32,871
$248,858
Q1
$176,546
$32,251
$208,797
Q1
$39,441
$620
Q2
$40,061
$29,792
$265,851
Q2
$190,169
$27,527
$217,696
Q2
$45,890
$2,265
$48,155
2020
$254,180
Q3
$26,761
$280,941
2020
Q3
$202,996
$25,331
2020
$228,327
Q3
$51,184
$1,430
$52,614
Q4
$282,534
$23,847
$306,381
Q4
$213,745
$22,675
$236,420
Q4
$68,789
$1,172
$69,961
2017
FY
$425,636
$58,353
$483,989
2017
FY
$391,347
$57,778
2017
FY
$34,289
$575
2018
FY
2019
FY
$603,704 $761,088
$34,864
$54,681
$658,385
$449,125 $580,119
2018
FY
$525,350
$54,769
2018
FY
$78,354
$(88)
$78,266
$71,397
$832,485
2019
FY
$644,491
$67,272
$711,763
2019
FY
$116,597
$4,125
$120,722
2020
FY
$988,760
$113,271
$1,102,031
2020
FY
$783,456
$107,784
$891,240
2020
FY
$205,304
$5,487
$210,791
WIX
14View entire presentation