UBS Results Presentation Deck
Investment Bank
Profit before tax
m
Operating
income
m
Cost / income ratio
Global
Banking
Global
Markets
632
2,485
651
215²
1,634
(15)
529
74%
3Q20
2,011
669
1,433
+32%
71%
4Q20
412
+1%
2,273
788
1,483
(91)
Gain on sale of intellectual property
2
82%
1Q21
668
2,470
881
1,567
21
74%
2Q21
837
UBS 1215m gain from the sale of intellectual property rights associated with the Bloomberg Commodity Index family
2,510
792
1,723
Credit loss (expenses)/releases
(5)
67%
3Q21
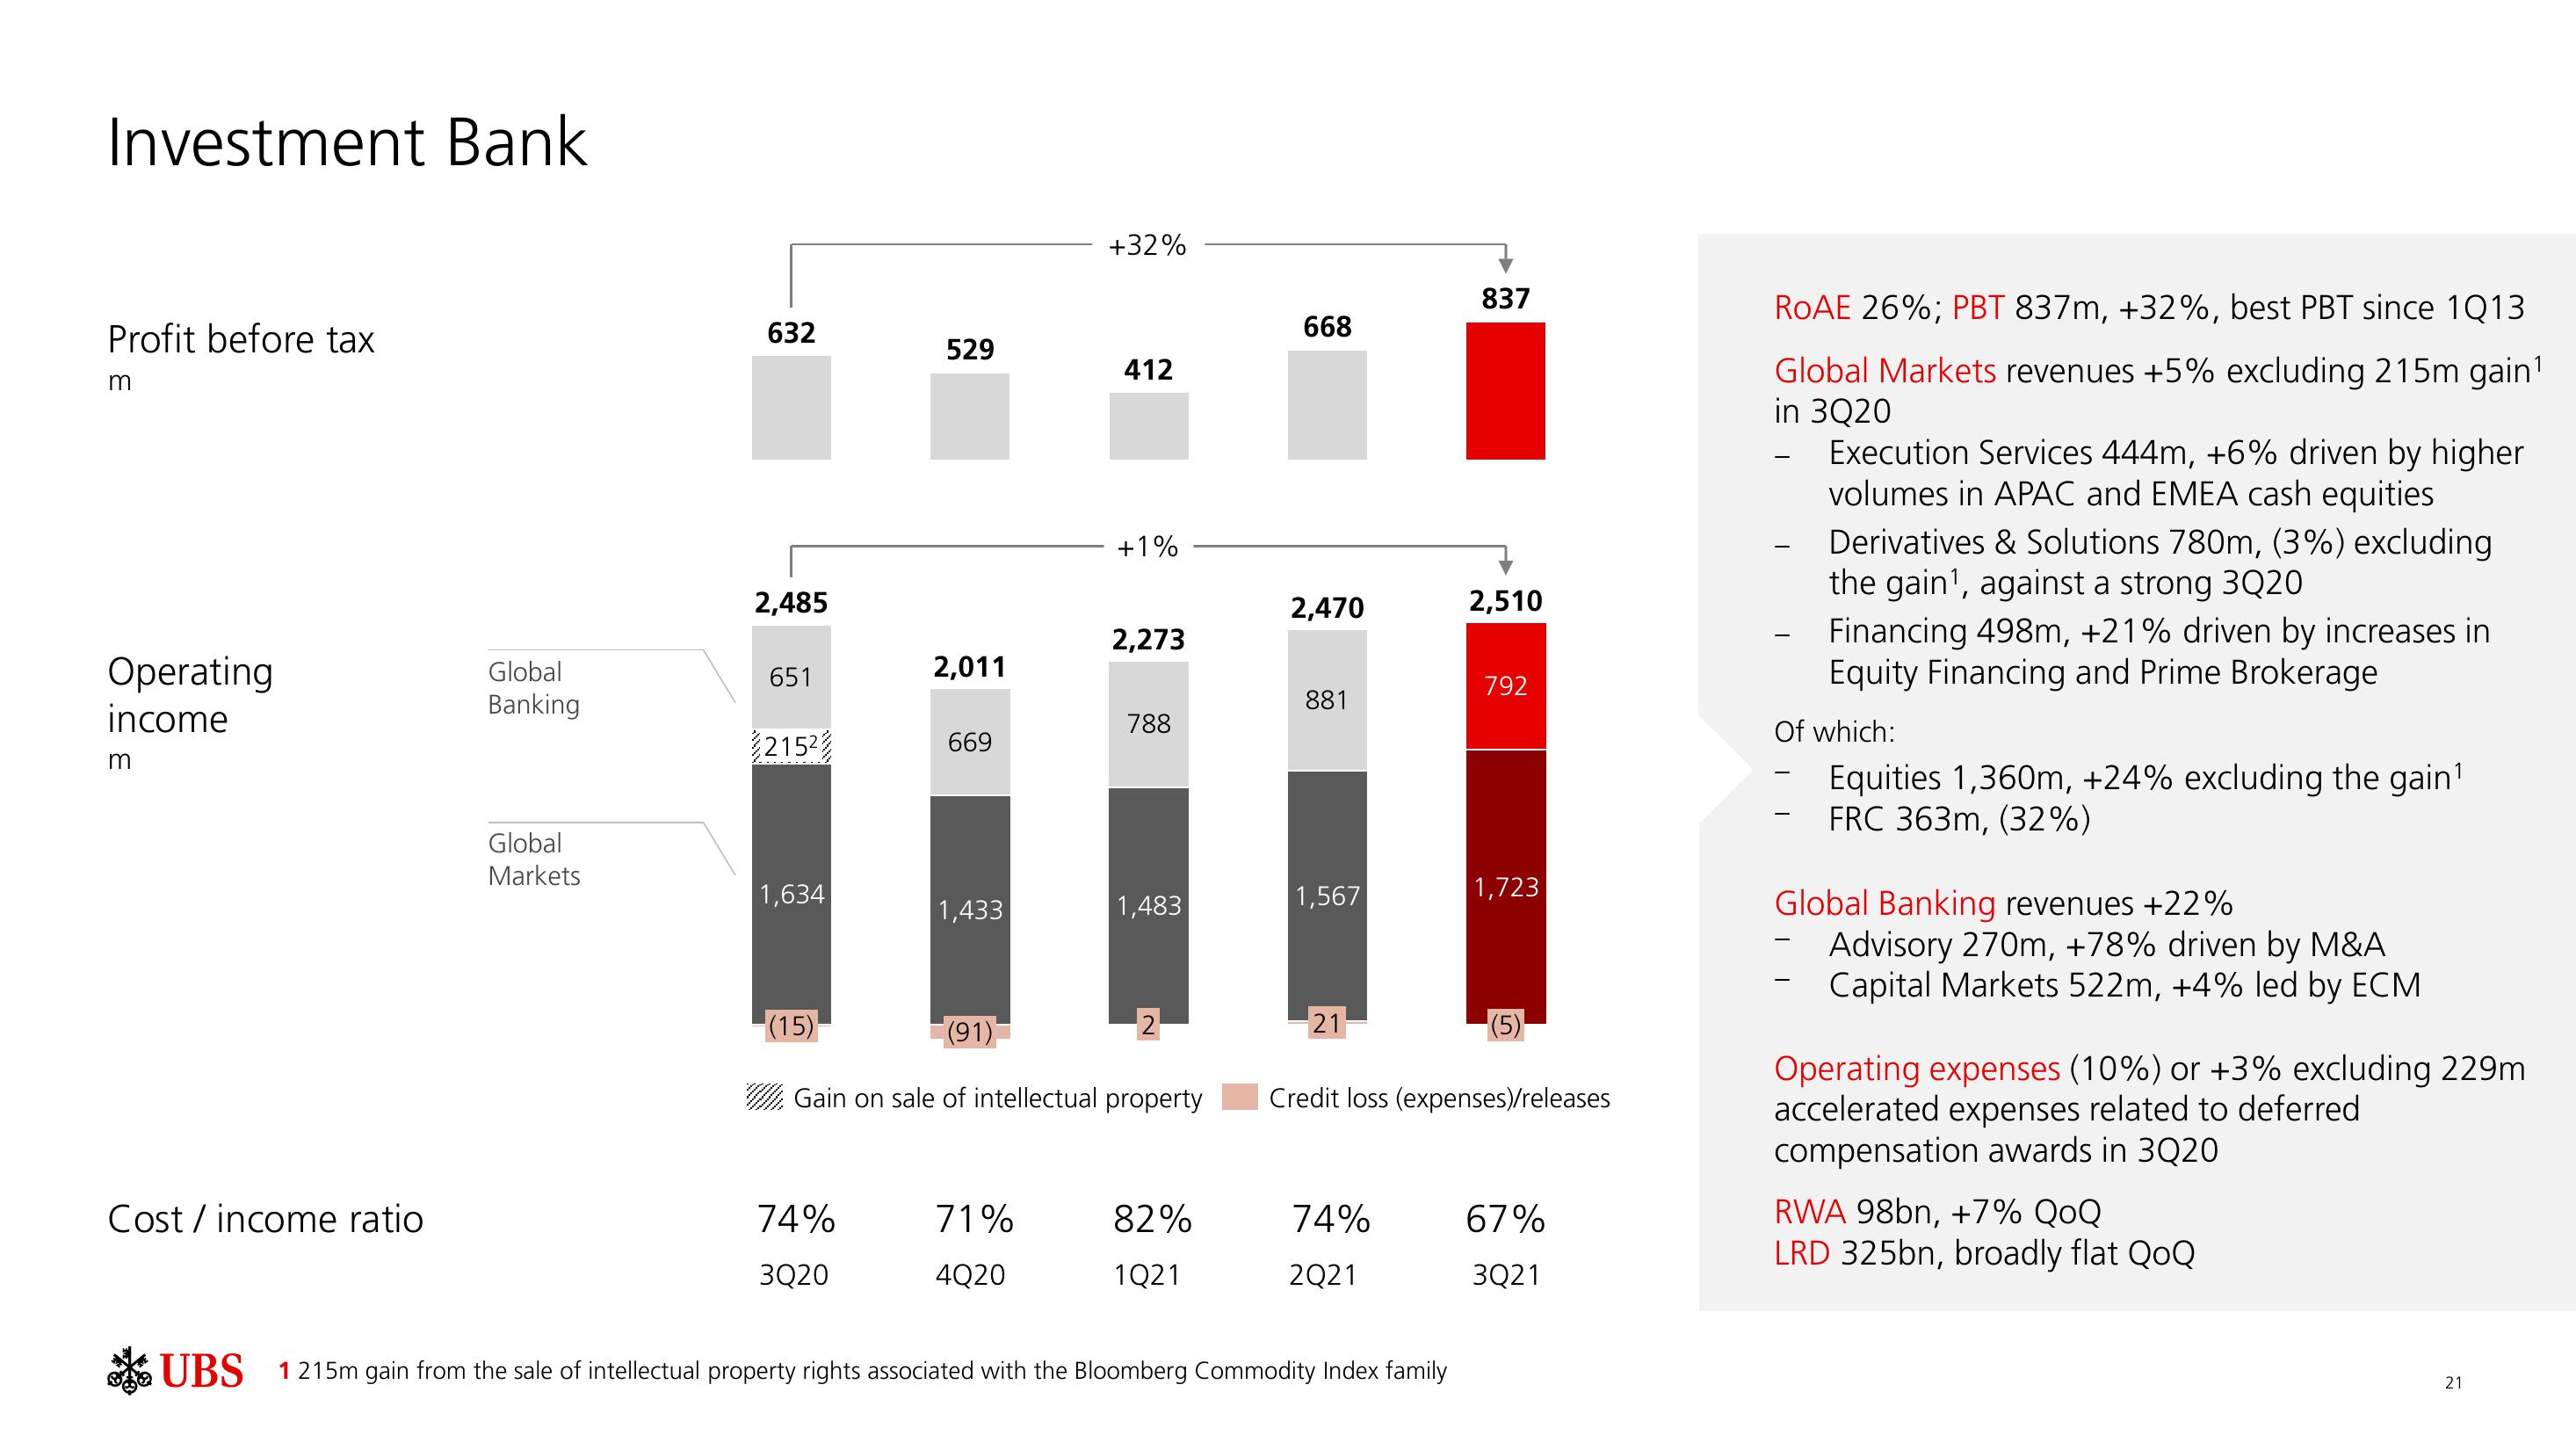
ROAE 26%; PBT 837m, +32%, best PBT since 1Q13
Global Markets revenues +5% excluding 215m gain¹
in 3Q20
-
-
-
Execution Services 444m, +6% driven by higher
volumes in APAC and EMEA cash equities
Of which:
Equities 1,360m, +24% excluding the gain¹
FRC 363m, (32%)
-
Derivatives & Solutions 780m, (3%) excluding
the gain¹, against a strong 3Q20
-
Financing 498m, +21% driven by increases in
Equity Financing and Prime Brokerage
Global Banking revenues +22%
Advisory 270m, +78% driven by M&A
Capital Markets 522m, +4% led by ECM
Operating expenses (10%) or +3% excluding 229m
accelerated expenses related to deferred
compensation awards in 3Q20
RWA 98bn, +7% QOQ
LRD 325bn, broadly flat QoQ
21View entire presentation