Aston Martin Lagonda Results Presentation Deck
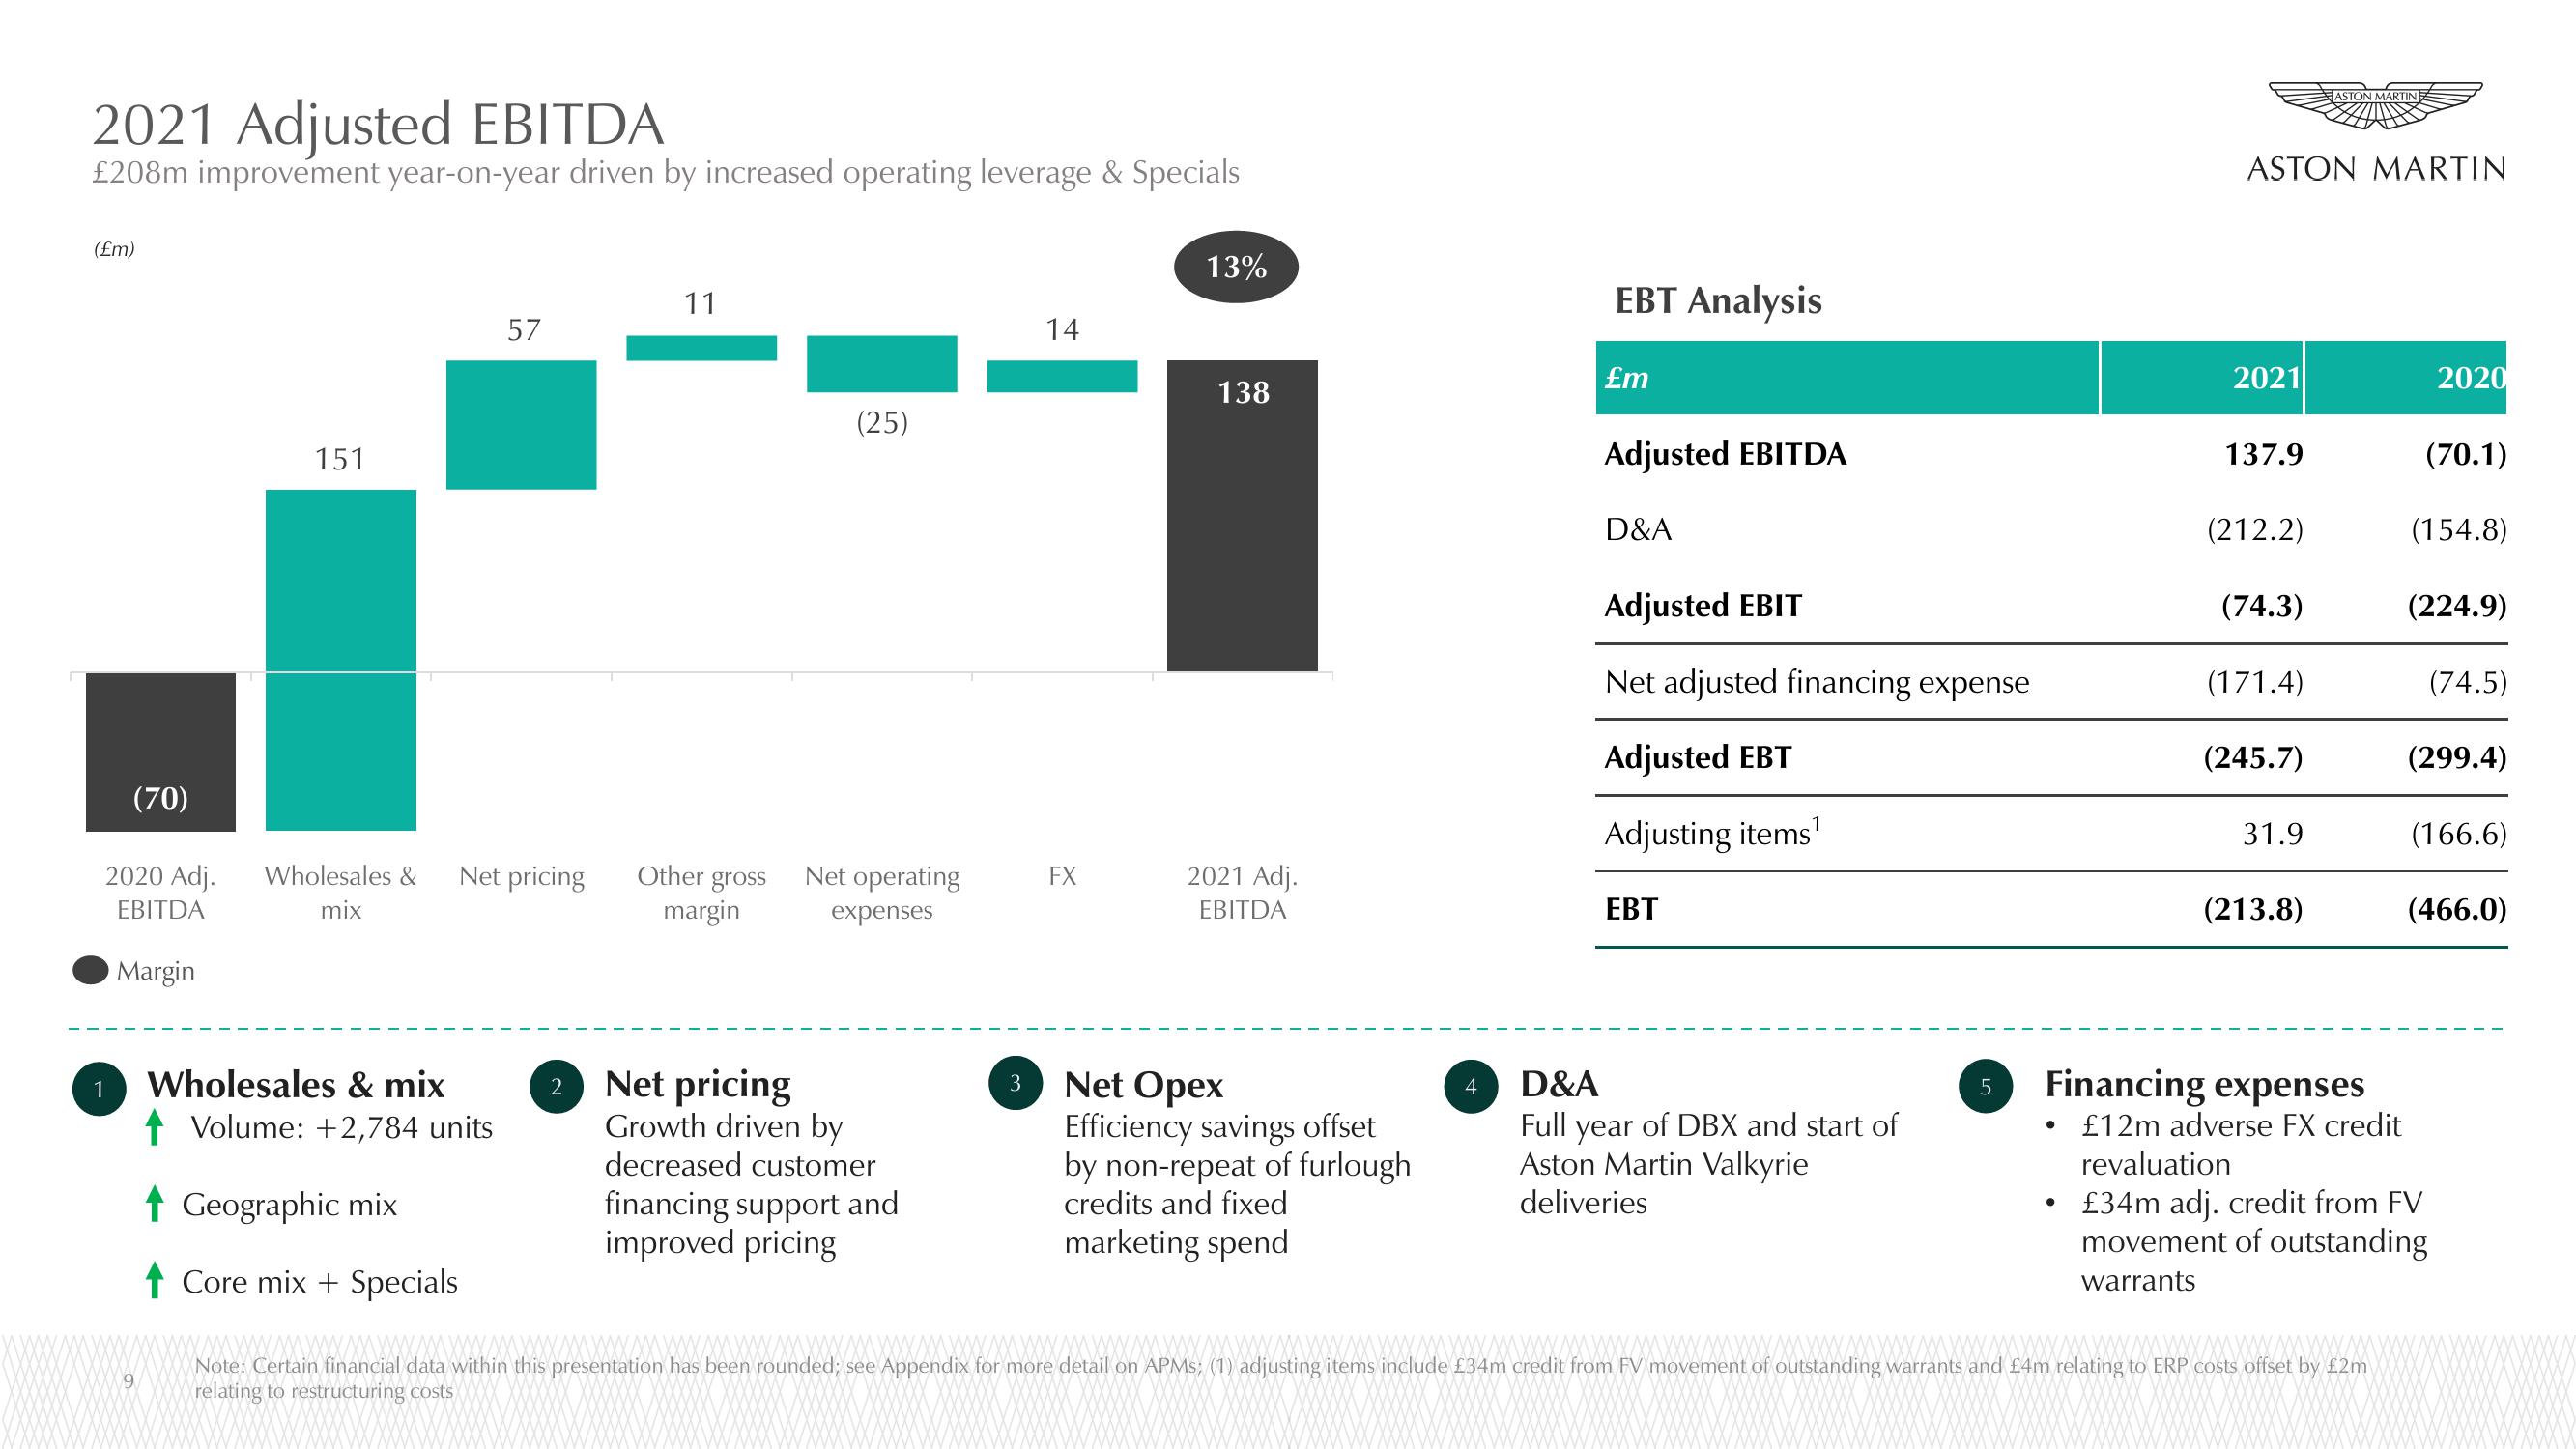
2021 Adjusted EBITDA
£208m improvement year-on-year driven by increased operating leverage & Specials
(£m)
(70)
2020 Adj.
EBITDA
Margin
1
9
151
Wholesales &
mix
Wholesales & mix
Volume: +2,784 units
↑ Geographic mix
Core mix+ Specials
57
Net pricing
11
(25)
Other gross Net operating
margin
expenses
2 Net pricing
Growth driven by
decreased customer
financing support and
improved pricing
14
FX
13%
138
2021 Adj.
EBITDA
3 Net Opex
Efficiency savings offset
by non-repeat of furlough
credits and fixed
marketing spend
4
EBT Analysis
£m
Adjusted EBITDA
D&A
Adjusted EBIT
Net adjusted financing expense
Adjusted EBT
Adjusting items¹
EBT
D&A
Full year of DBX and start of
Aston Martin Valkyrie
deliveries
5
ASTON MARTIN
2021
●
137.9
(212.2)
(74.3)
(171.4)
(245.7)
31.9
ASTON MARTIN
(213.8)
Financing expenses
Note: Certain financial data within this presentation has been rounded; see Appendix for more detail on APMs; (1) adjusting items include £34m credit from FV movement of outstanding warrants and £4m relating to ERP costs offset by £2m
relating to restructuring costs
2020
(70.1)
(154.8)
(224.9)
(74.5)
£12m adverse FX credit
revaluation
●
• £34m adj. credit from FV
movement of outstanding
warrants
(299.4)
(166.6)
(466.0)View entire presentation