BigCommerce Results Presentation Deck
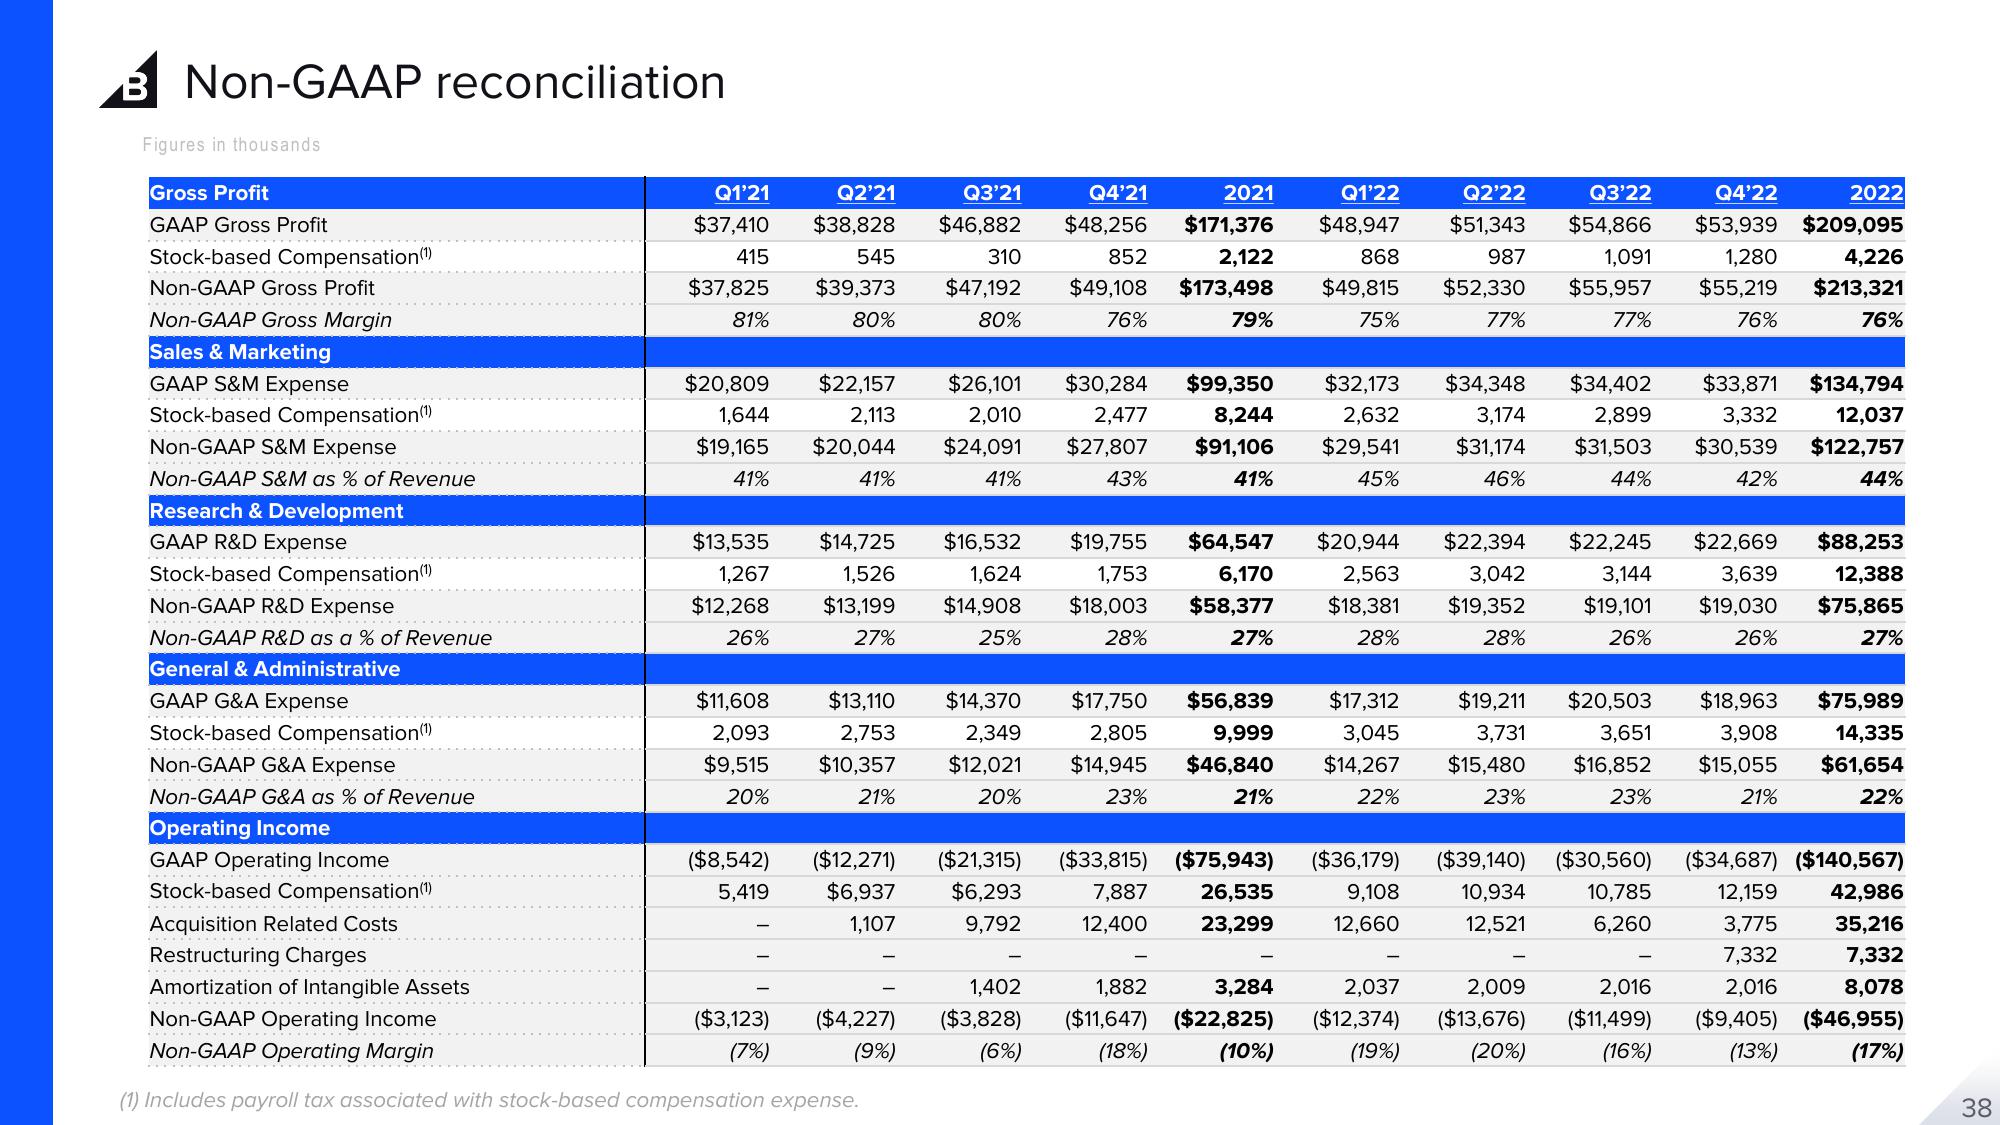
Non-GAAP reconciliation
Figures in thousands
Gross Profit
GAAP Gross Profit
Stock-based Compensation (¹)
Non-GAAP Gross Profit
Non-GAAP Gross Margin
Sales & Marketing
GAAP S&M Expense
Stock-based Compensation(¹)
Non-GAAP S&M Expense
Non-GAAP S&M as % of Revenue
Research & Development
GAAP R&D Expense
Stock-based Compensation (¹)
Non-GAAP R&D Expense
Non-GAAP R&D as a % of Revenue
General & Administrative
GAAP G&A Expense
Stock-based Compensation (¹)
Non-GAAP G&A Expense
Non-GAAP G&A as % of Revenue
Operating Income
GAAP Operating Income
Stock-based Compensation (¹)
Q1'21
$37,410
415
$37,825
81%
$20,809
1,644
$19,165
41%
$13,535
1,267
$12,268
26%
$11,608
2,093
$9,515
20%
($8,542)
5,419
Q2'21
Q3'21
$38,828 $46,882
545
$39,373
80%
($3,123)
(7%)
$22,157
2,113
$20,044
41%
$14,725
1,526
$13,199
27%
Acquisition Related Costs
Restructuring Charges
Amortization of Intangible Assets
Non-GAAP Operating Income
Non-GAAP Operating Margin
(1) Includes payroll tax associated with stock-based compensation expense.
310
$47,192
80%
$26,101
2,010
$24,091
41%
$13,110 $14,370
2,753
2,349
$10,357 $12,021
21%
20%
($4,227)
(9%)
$16,532
1,624
$14,908
25%
($12,271) ($21,315)
$6,937
1,107
$6,293
9,792
1,402
($3,828)
(6%)
Q4'21
2021
$48,256 $171,376
852
2,122
$49,108 $173,498
79%
76%
$30,284
2,477
$27,807
43%
$99,350 $32,173
8,244
$91,106
41%
2,632
$29,541
45%
Q1'22
$48,947
868
$49,815
75%
$19,755 $64,547 $20,944
1,753
6,170 2,563
$18,003 $58,377 $18,381
28%
27%
28%
$17,750 $56,839
2,805
9,999
$14,945 $46,840
23%
21%
1,882 3,284
($11,647) ($22,825)
(18%) (10%)
($33,815) ($75,943) ($36,179)
7,887 26,535
9,108
12,400
23,299
12,660
Q2'22
Q3'22
$51,343 $54,866
987
1,091
$52,330 $55,957
77%
77%
2,037
($12,374)
(19%)
$34,348
3,174
$31,174
46%
$17,312 $19,211 $20,503
3,045
3,731 3,651
$14,267 $15,480 $16,852
22%
23%
23%
$22,394 $22,245
3,042
3,144
$19,352 $19,101
28%
26%
$34,402 $33,871
2,899
3,332
$31,503 $30,539
44%
42%
($39,140)
10,934
12,521
($30,560)
10,785
6,260
Q4'22
2022
$53,939 $209,095
1,280 4,226
$55,219 $213,321
76%
76%
2,009
2,016
($13,676) ($11,499)
(20%)
(16%)
$134,794
12,037
$122,757
44%
$22,669 $88,253
3,639 12,388
$19,030 $75,865
26%
27%
$18,963
3,908
$15,055
21%
$75,989
14,335
$61,654
22%
($34,687) ($140,567)
12,159
42,986
3,775
35,216
7,332
7,332
2,016 8,078
($9,405) ($46,955)
(13%)
(17%)
38View entire presentation