Wix Results Presentation Deck slide image

Wix Results Presentation Deck

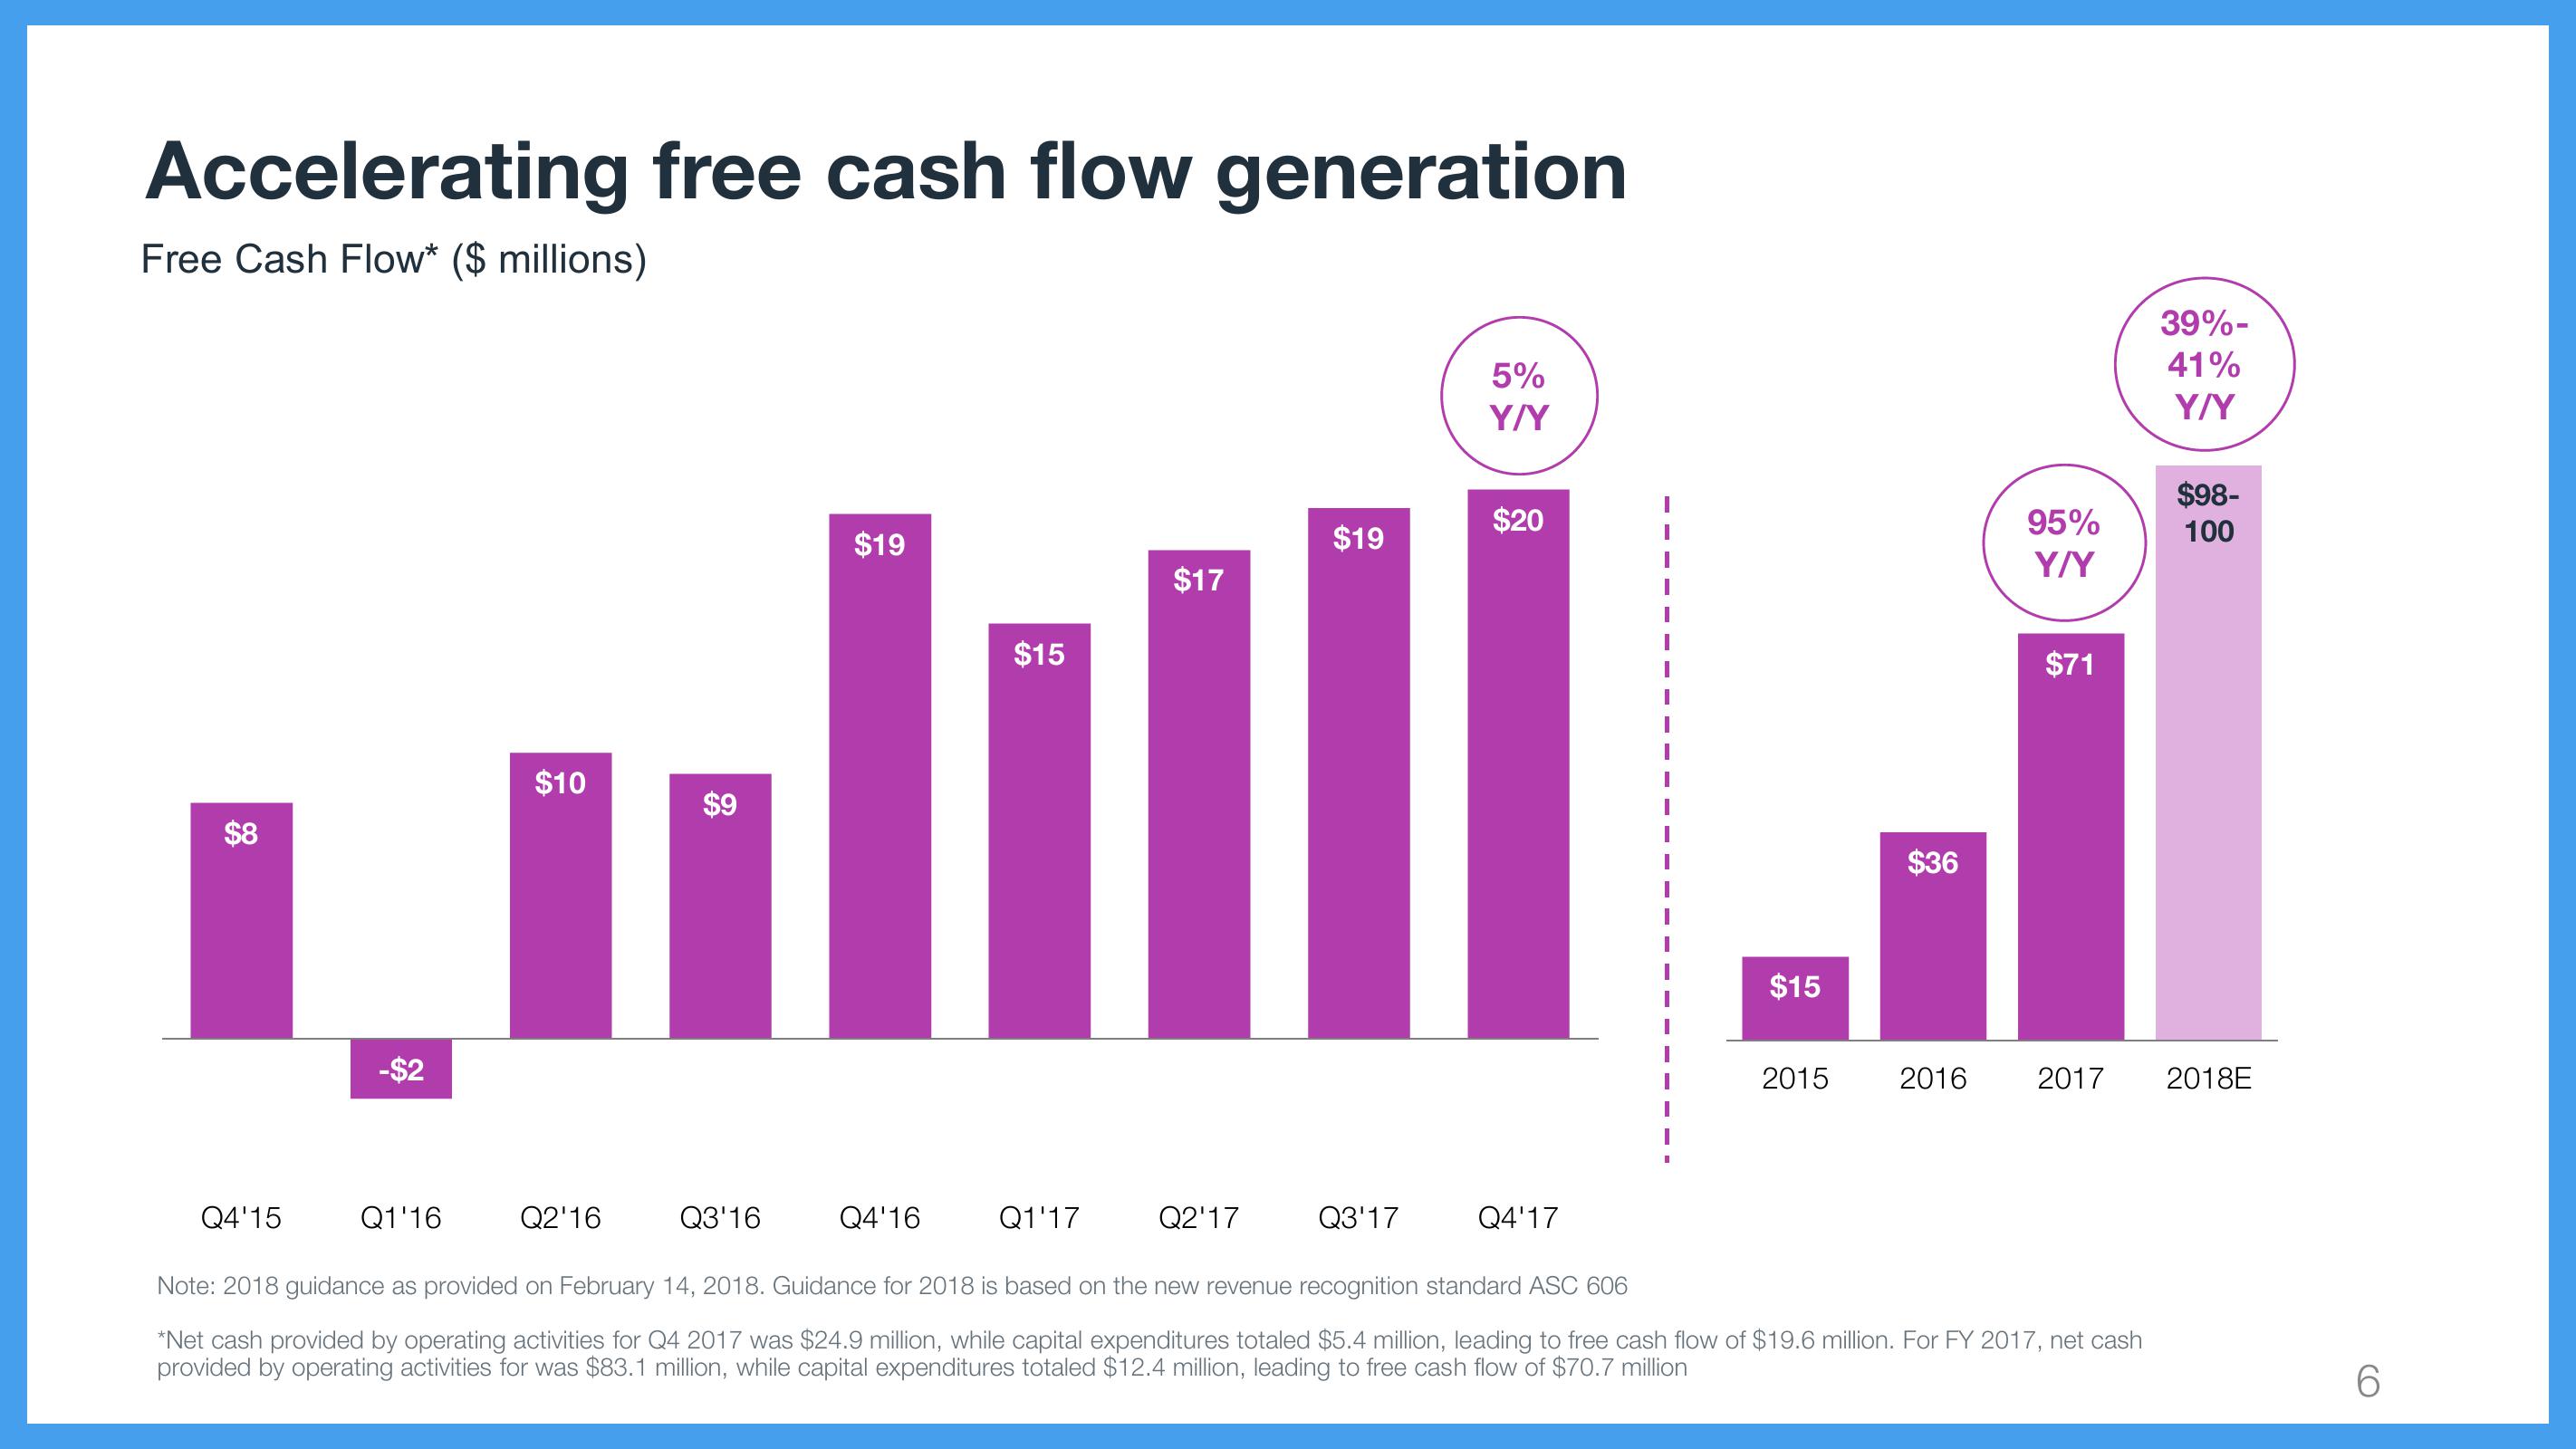
Accelerating free cash flow generation Free Cash Flow* ($ millions) $8 Q4'15 Q1'16 $10 Q2'16 الس Q3'16 $19 Q4'16 $15 Q1'17 $17 Q2'17 $19 Q3'17 5% Y/Y $20 Q4'17 $15 2015 $36 2016 95% Y/Y $71 2017 Note: 2018 guidance as provided on February 14, 2018. Guidance for 2018 is based on the new revenue recognition standard ASC 606 *Net cash provided by operating activities for Q4 2017 was $24.9 million, while capital expenditures totaled $5.4 million, leading to free cash flow of $19.6 million. For FY 2017, net cash provided by operating activities for was $83.1 million, while capital expenditures totaled $12.4 million, leading to free cash flow of $70.7 million 39%- 41% Y/Y $98- 100 2018E 6
View entire presentation