PJT Partners Investment Banking Pitch Book
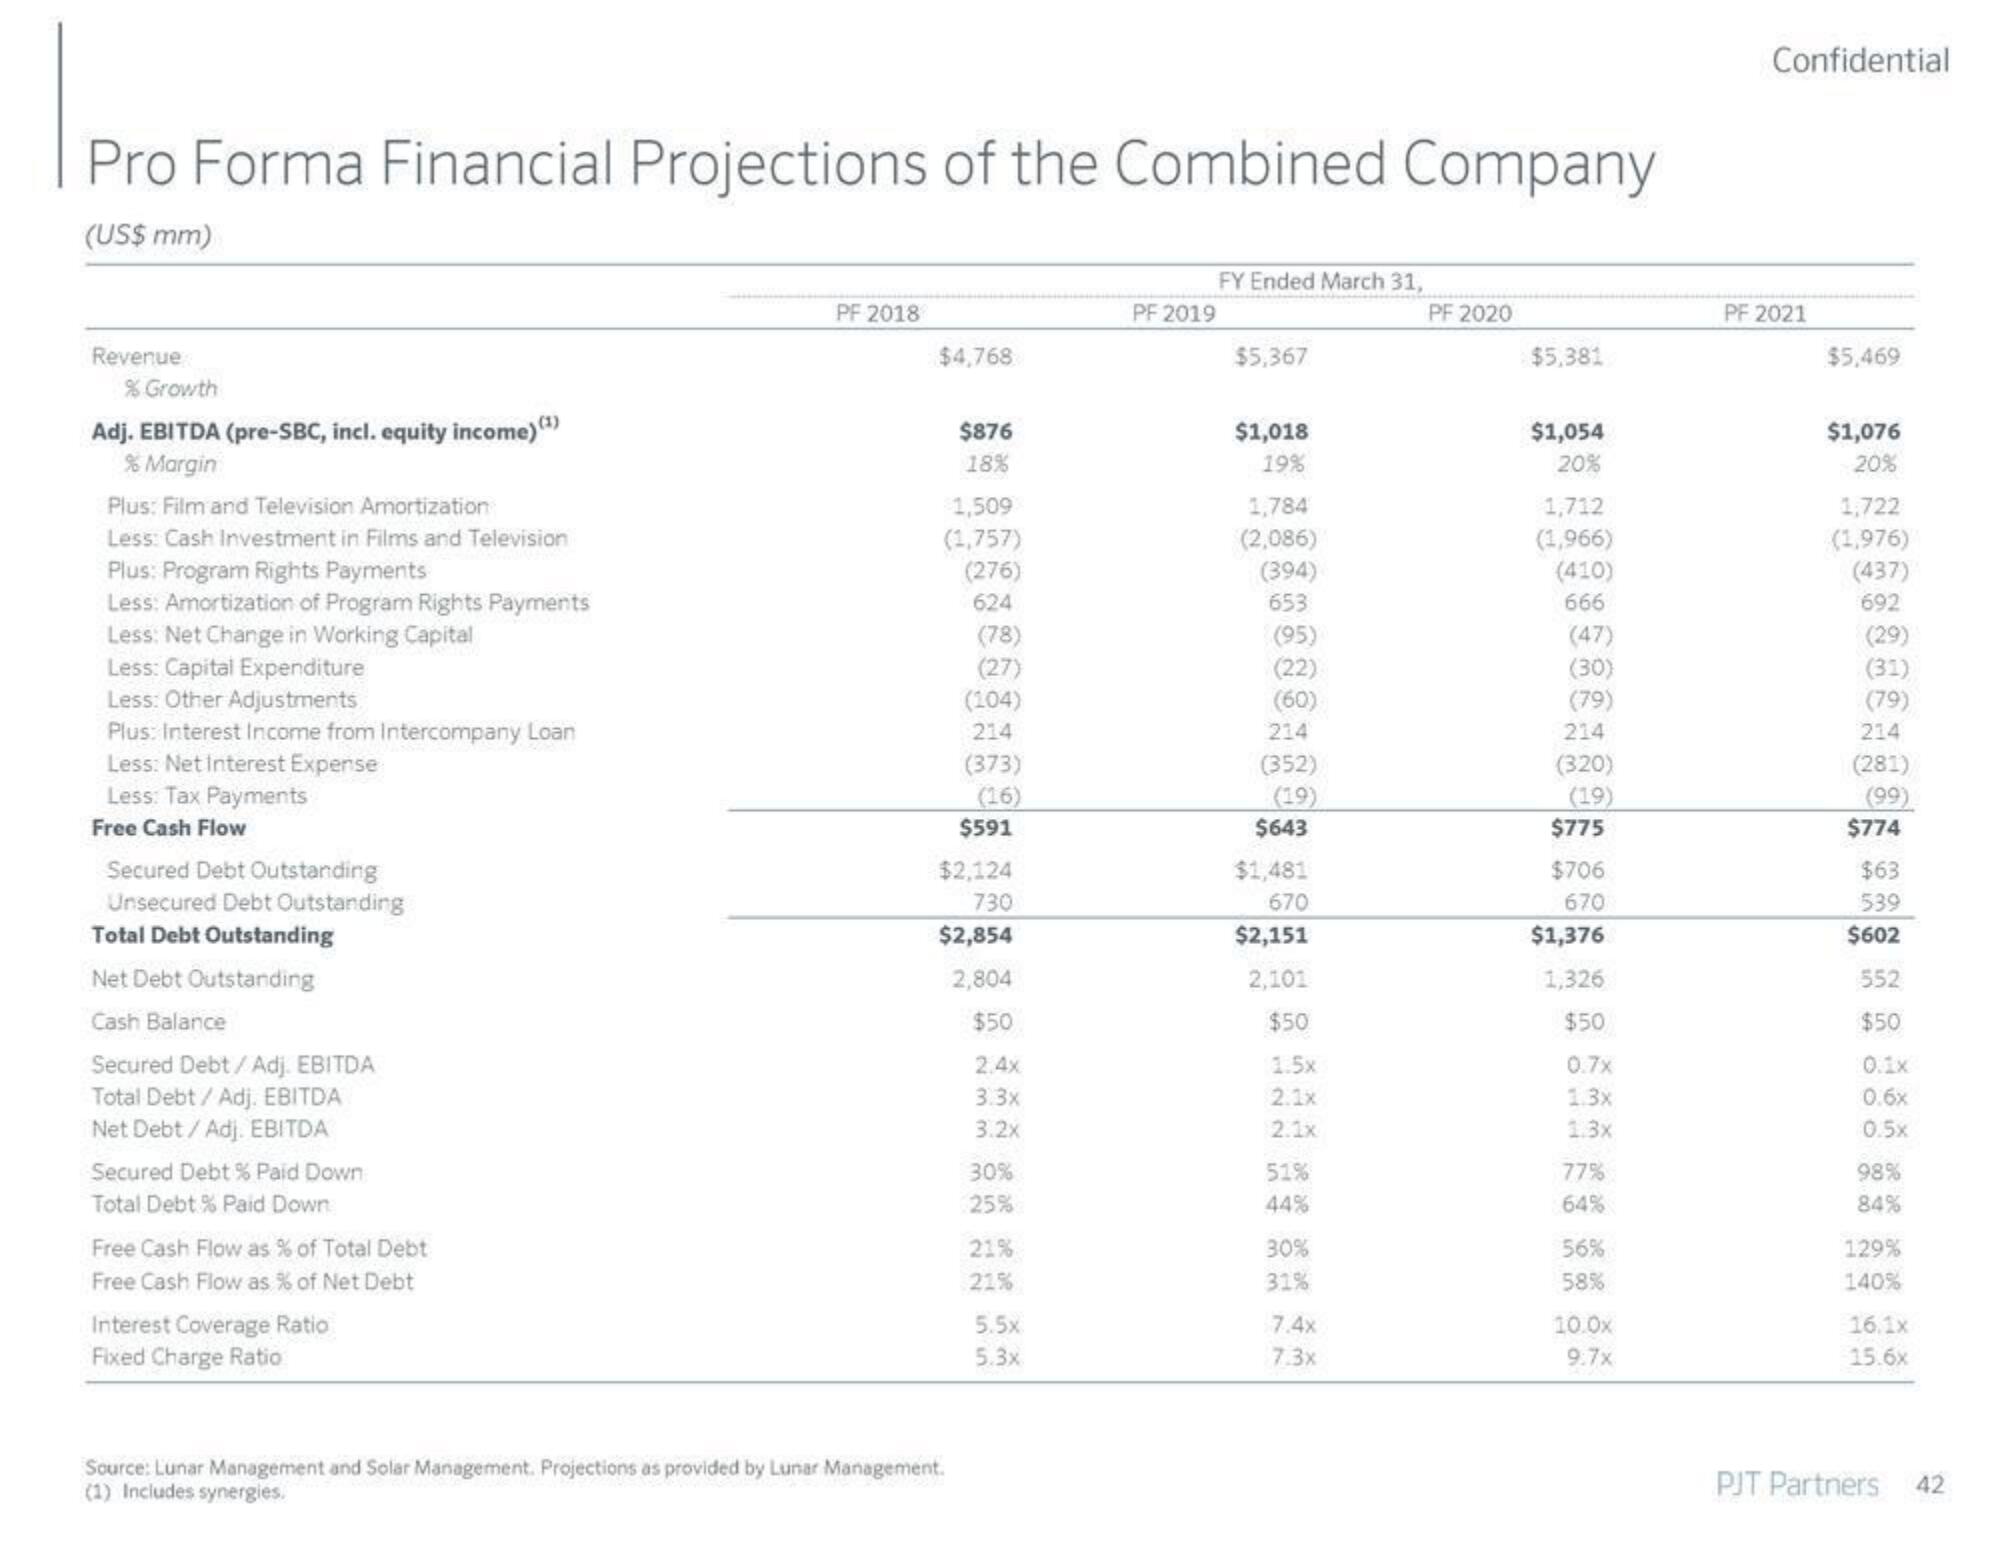
Pro Forma Financial Projections of the Combined Company
(US$ mm)
Revenue
% Growth
Adj. EBITDA (pre-SBC, incl. equity income) (¹)
% Margin
Plus: Film and Television Amortization
Less: Cash Investment in Films and Television
Plus: Program Rights Payments
Less: Amortization of Program Rights Payments
Less: Net Change in Working Capital
Less: Capital Expenditure
Less: Other Adjustments
Plus: Interest Income from Intercompany Loan
Less: Net Interest Expense
Less: Tax Payments
Free Cash Flow
Secured Debt Outstanding
Unsecured Debt Outstanding
Total Debt Outstanding
Net Debt Outstanding
Cash Balance
Secured Debt / Adj. EBITDA
Total Debt / Adj. EBITDA
Net Debt / Adj. EBITDA
Secured Debt % Paid Down
Total Debt % Paid Down
Free Cash Flow as % of Total Debt
Free Cash Flow as % of Net Debt
Interest Coverage Ratio
Fixed Charge Ratio
PF 2018
$4,768
$876
18%
1,509
(1,757)
(276)
624
Source: Lunar Management and Solar Management. Projections as provided by Lunar Management.
(1) Includes synergies.
(78)
(27)
(104)
214
(373)
(16)
$591
$2,124
730
$2,854
2,804
$50
2.4x
3.3x
3.2x
30%
25%
21%
21%
5.5x
5.3x
PF 2019
FY Ended March 31,
$5,367
$1,018
19%
1,784
(2,086)
(394)
653
(95)
(22)
(60)
214
(352)
(19)
$643
$1,481
670
$2,151
2,101
$50
1.5x
2.1x
2.1x
51%
44%
30%
31%
7.4x
7.3x
PF 2020
$5,381
$1,054
20%
1,712
(1,966)
(410)
666
(47)
(30)
(79)
214
(320)
(19)
$775
$706
670
$1,376
1,326
$50
0.7x
1.3x
1.3x
77%
64%
56%
58%
10.0x
9.7x
Confidential
PF 2021
$5,469
$1,076
20%
1,722
(1,976)
(437)
692
(29)
(31)
(79)
214
(281)
(99)
$774
$63
539
$602
552
$50
0.6x
0.5x
98%
84%
129%
140%
16.1x
15.6x
PJT Partners
42View entire presentation