Flutter Results Presentation Deck
KPI: Average monthly players
1,2
Average Monthly Players ¹,²
Pro forma ('000s)
2021
Group
UK & Ireland
Australia
International
US
2020
Group
UK & Ireland
Australia
International
US
YOY %
Group
UK & Ireland
Australia
International
US
Flutter
Q1
7,672
3,167
831
2,027
1,648
Q1
5,635
2,571
581
1,774
710
Q1
+36%
+23%
+43%
+14%
+132%
Q2
7,578
3,440
982
1,863
1,292
Q2
5,256
2,027
611
2,223
395
Q2
+44%
+70%
+61%
-16%
+227%
Q3
7,257
3,060
1,086
1,799
1,312
Q3
6,401
2,567
876
1,835
1,122
Q3
+13%
+19%
+24%
-2%
+17%
Q4
7,969
2,946
1,133
1,915
1,975
Q4
7,404
2,964
1,109
1,918
1,413
Q4
+8%
-1%
+2%
flat
+40%
H1
7,625
3,303
906
1,945
1,470
H1
5,445
2,299
596
1,999
552
H1
+40%
+44%
+52%
-3%
+166%
H2
7,613
3,003
1,109
1,857
1,643
H2
6,902
2,765
992
1,877
1,268
H2
+10%
+9%
+12%
-1%
+30%
FY
7,619
3,153
1,008
1,901
1,557
FY
6,174
2,532
794
1,938
910
FY
+23%
+25%
+27%
-2%
+71%
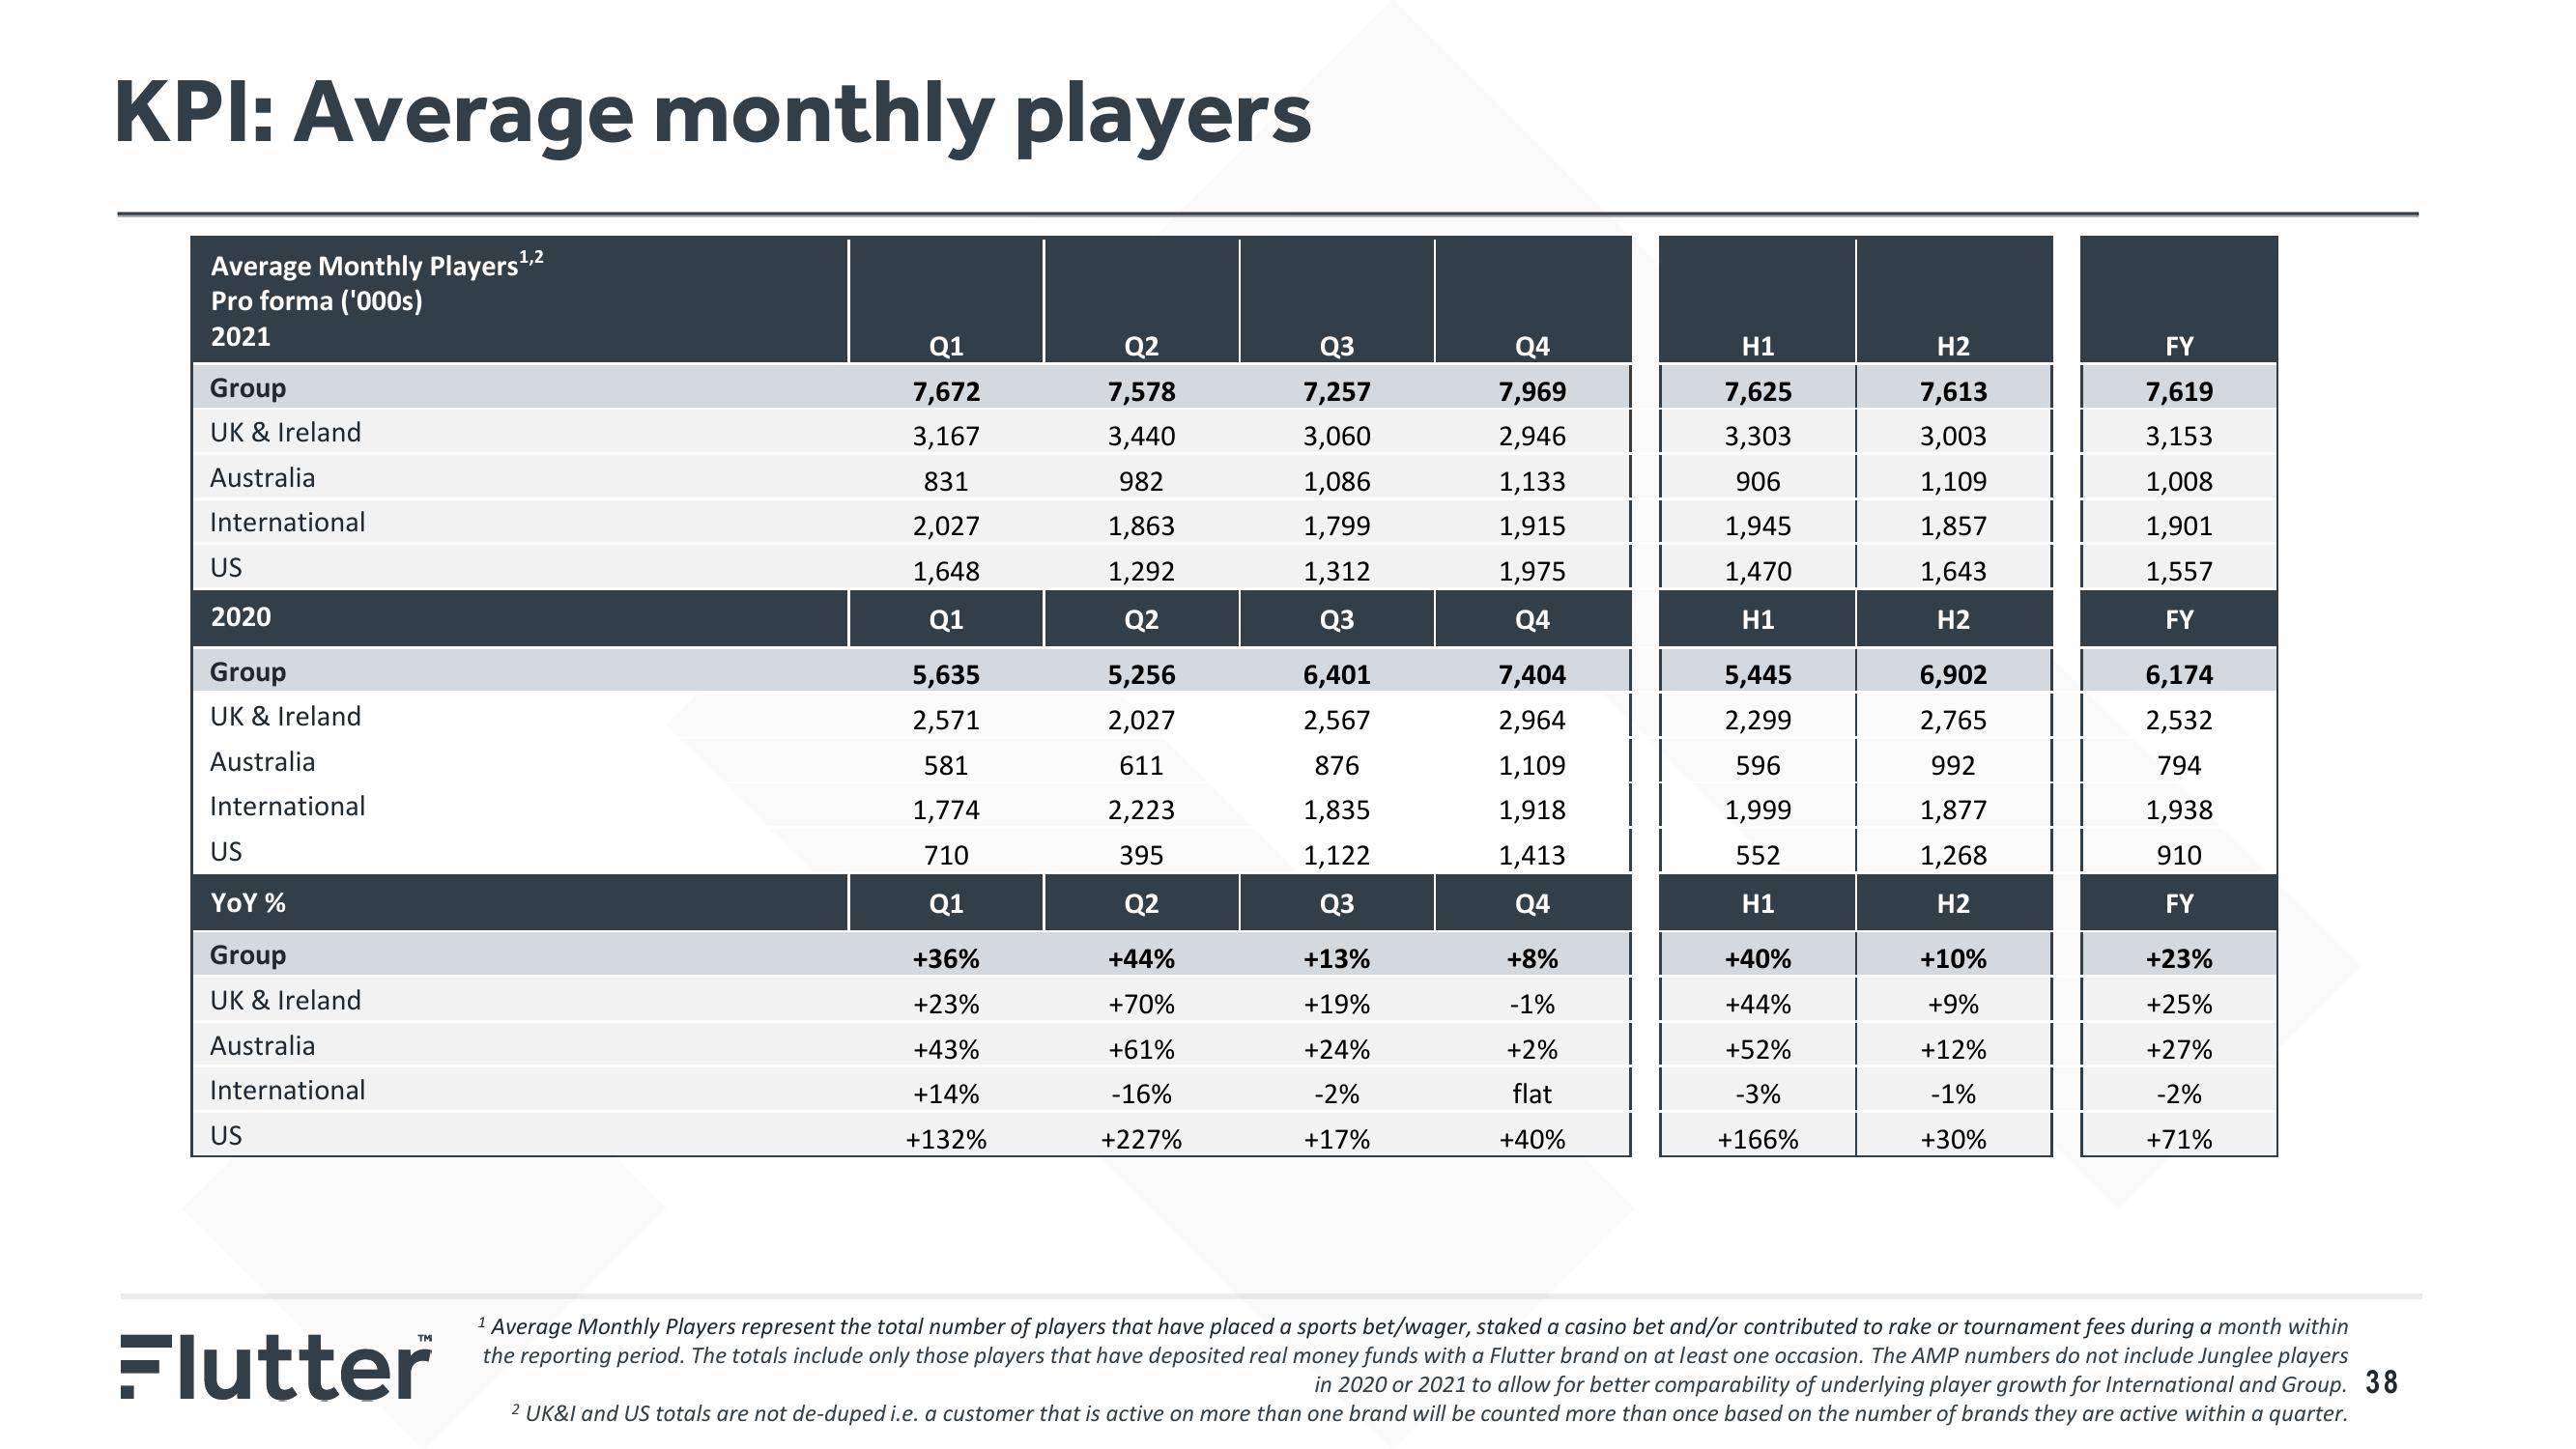
¹ Average Monthly Players represent the total number of players that have placed a sports bet/wager, staked a casino bet and/or contributed to rake or tournament fees during a month within
the reporting period. The totals include only those players that have deposited real money funds with a Flutter brand on at least one occasion. The AMP numbers do not include Junglee players
in 2020 or 2021 to allow for better comparability of underlying player growth for International and Group. 38
2 UK&I and US totals are not de-duped i.e. a customer that is active on more than one brand will be counted more than once based on the number of brands they are active within a quarter.View entire presentation