Dragonfly Energy SPAC Presentation Deck
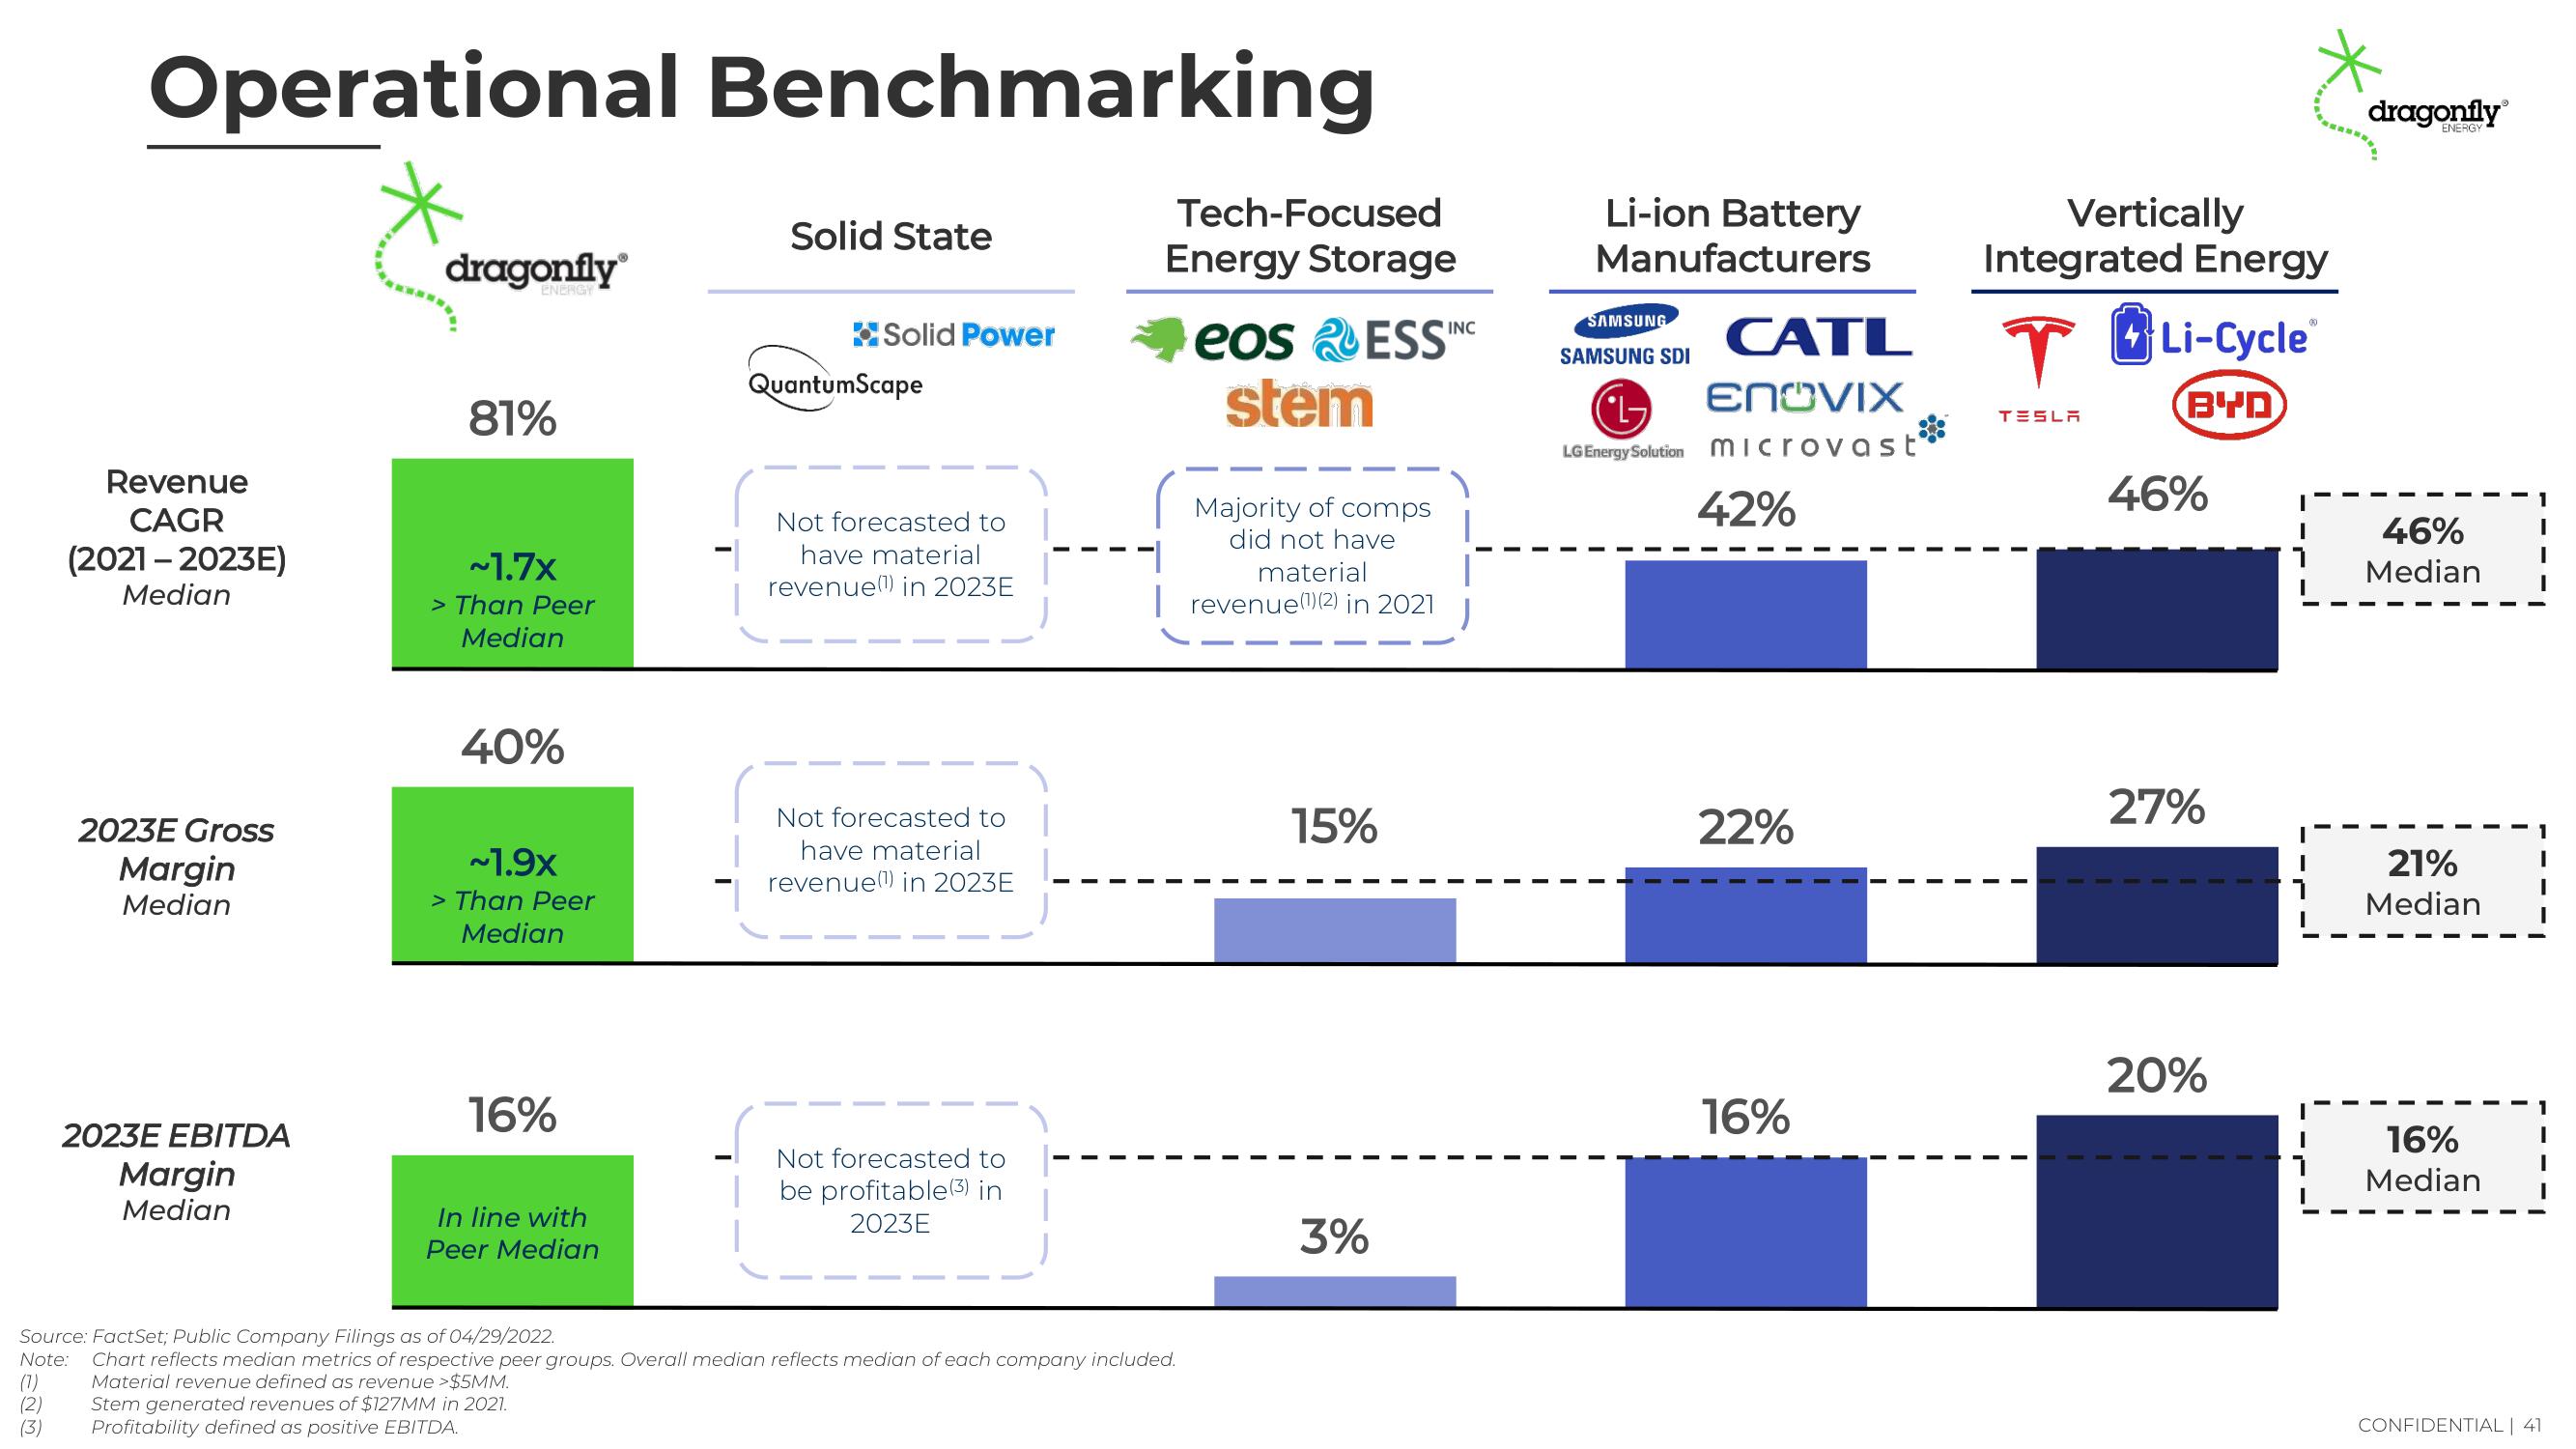
Operational Benchmarking
Revenue
CAGR
(2021-2023E)
Median
2023E Gross
Margin
Median
2023E EBITDA
Margin
Median
dragonfly
ENERGY
81%
~1.7x
> Than Peer
Median
40%
~1.9x
> Than Peer
Median
(7)
(2)
(3) Profitability defined as positive EBITDA.
16%
In line with
Peer Median
Solid State
Solid Power
QuantumScape
Not forecasted to
have material
revenue(¹) in 2023E
Not forecasted to
have material
revenue(¹) in 2023E
Not forecasted to
be profitable (³) in
2023E
Tech-Focused
Energy Storage
eos ESS
stem
Source: FactSet; Public Company Filings as of 04/29/2022.
Note: Chart reflects median metrics of respective peer groups. Overall median reflects median of each company included.
Material revenue defined as revenue >$5MM.
Stem generated revenues of $127MM in 2021.
Majority of comps
did not have
material
revenue(1)(2) in 2021
15%
3%
INC
Li-ion Battery
Manufacturers
SAMSUNG
SAMSUNG SDI
CATL
(L
ENOVIX
LG Energy Solution microvast
42%
22%
16%
Vertically
Integrated Energy
T
Li-Cycle
BYD
TESLA
46%
27%
20%
dragonfly
46%
Median
21%
Median
16%
Median
CONFIDENTIAL | 41View entire presentation