Credit Suisse Results Presentation Deck
Wealth Management
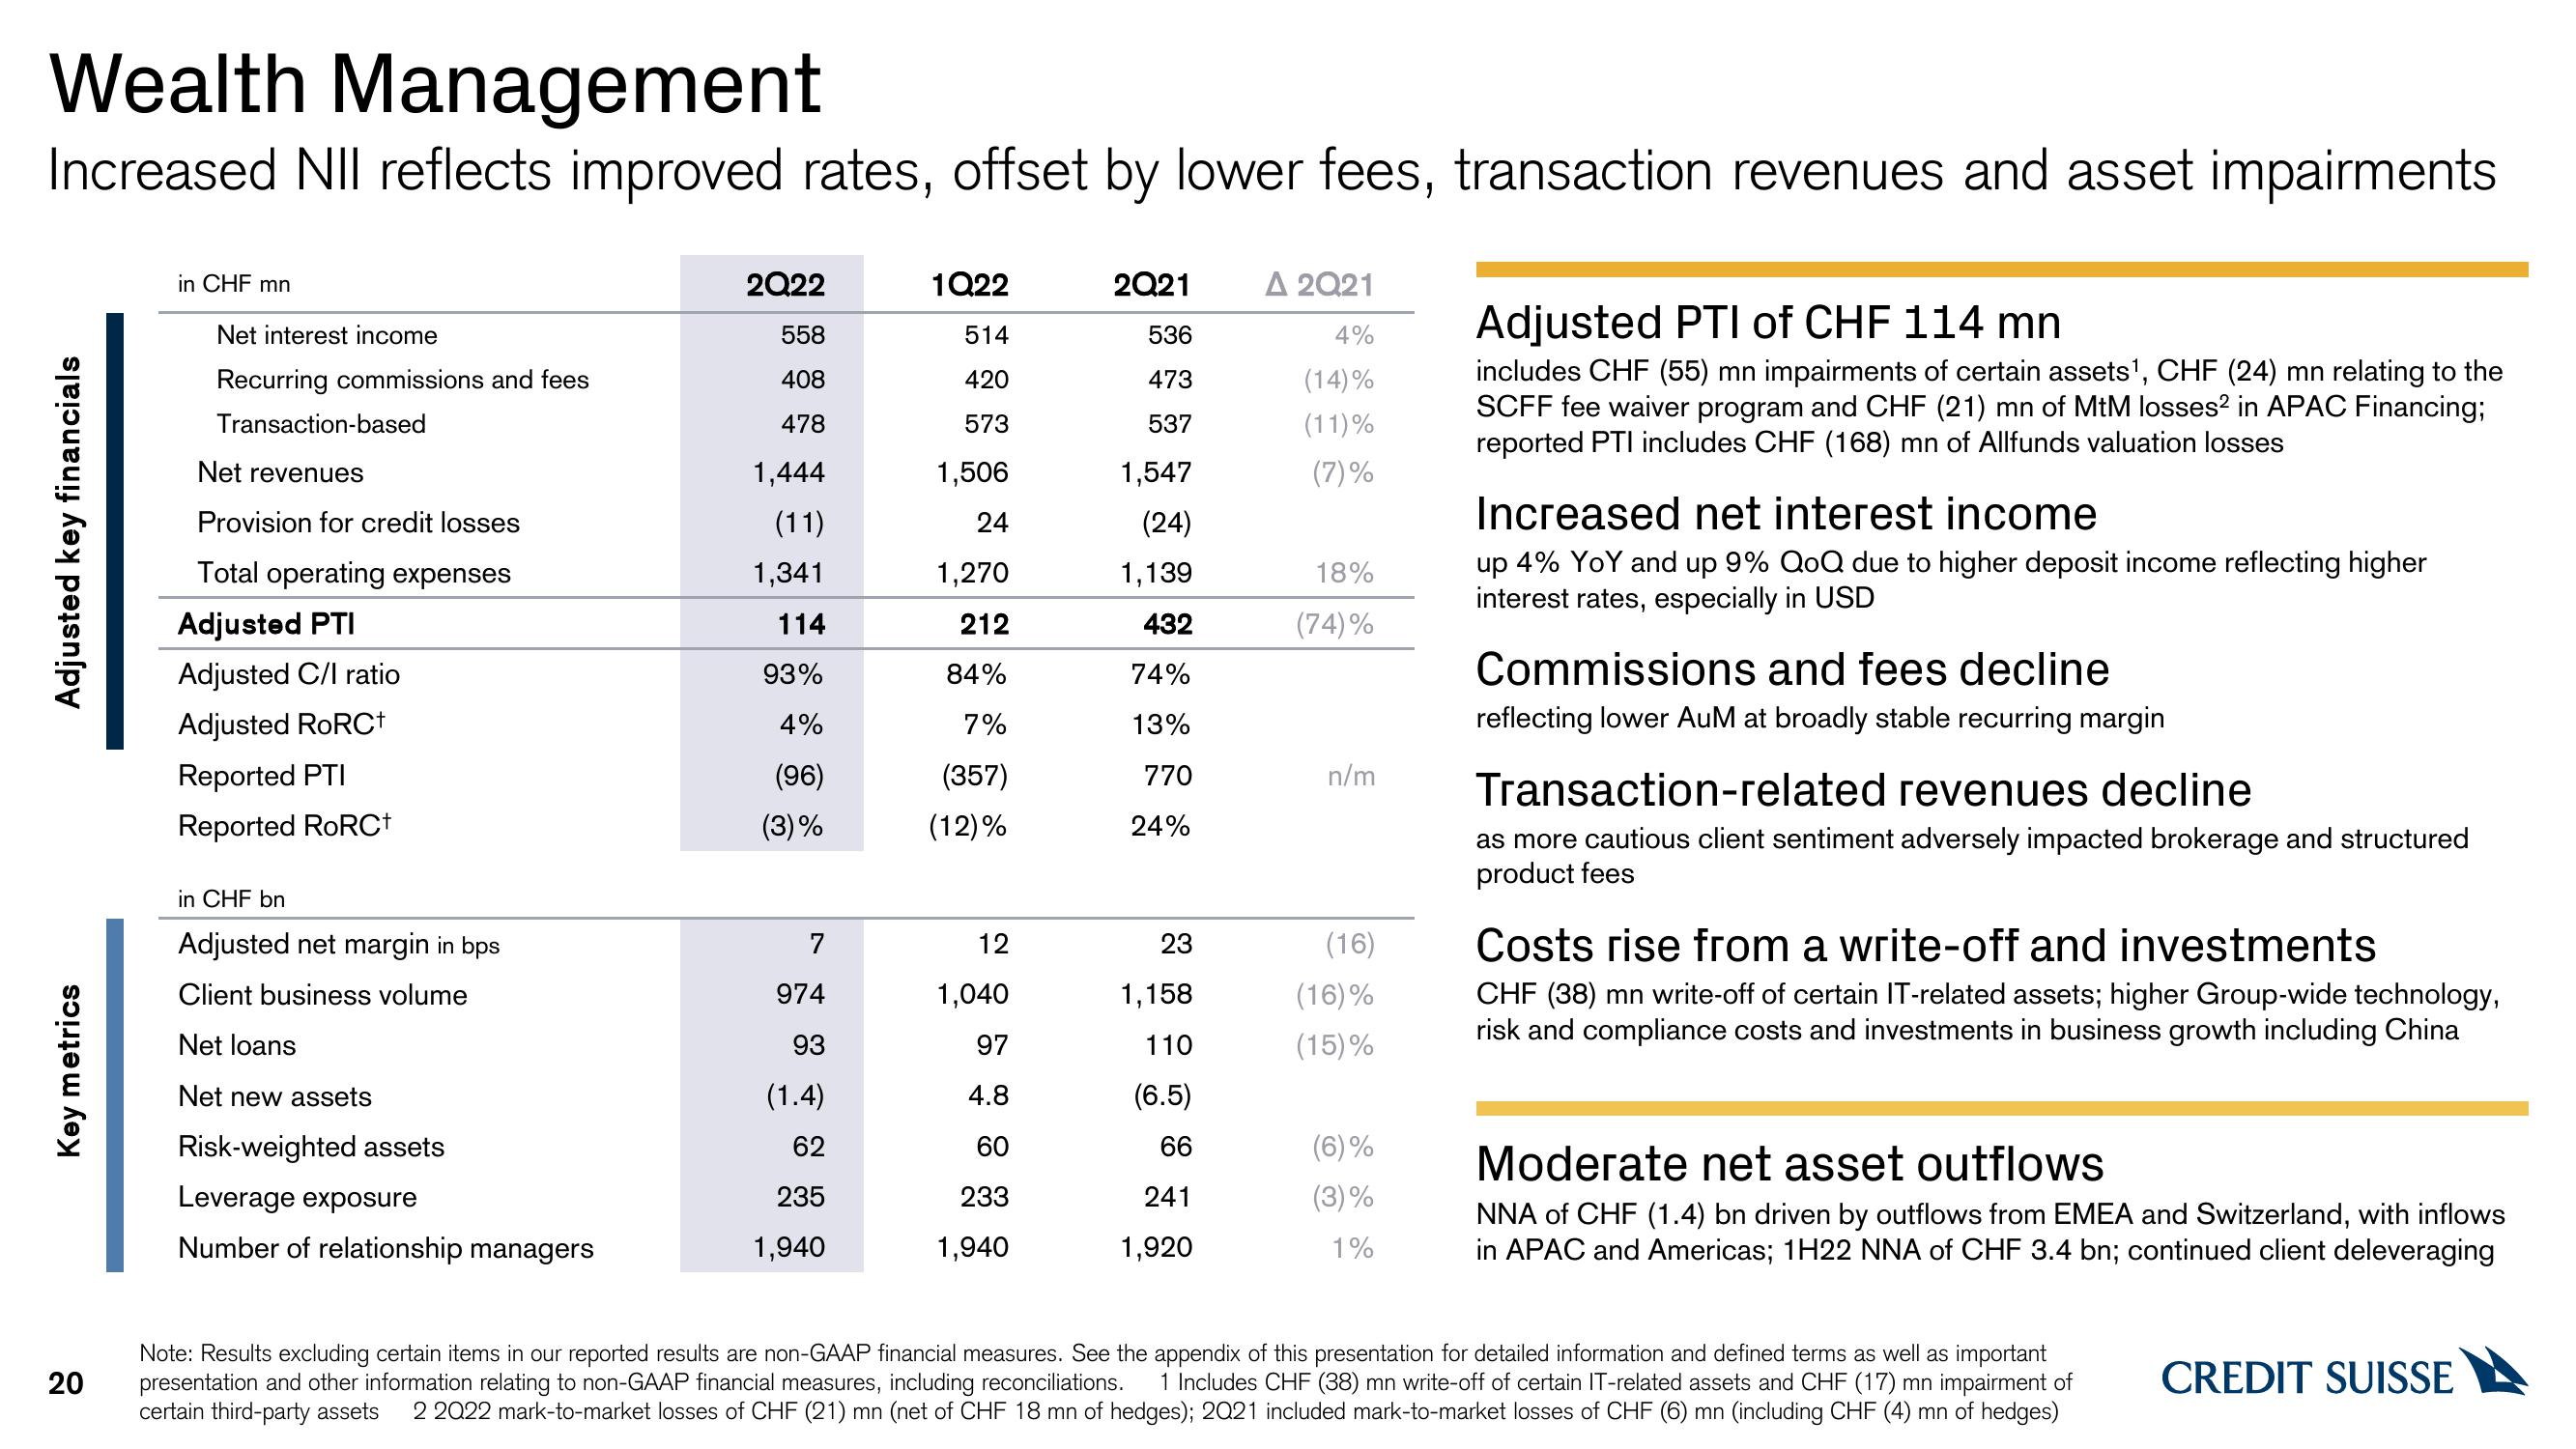
Increased NII reflects improved rates, offset by lower fees, transaction revenues and asset impairments
Adjusted key financials
Key metrics
20
in CHF mn
Net interest income
Recurring commissions and fees
Transaction-based
Net revenues
Provision for credit losses
Total operating expenses
Adjusted PTI
Adjusted C/I ratio
Adjusted RoRC+
Reported PTI
Reported RoRCt
in CHF bn
Adjusted net margin in bps
Client business volume
Net loans
Net new assets
Risk-weighted assets
Leverage exposure
Number of relationship managers
2Q22
558
408
478
1,444
(11)
1,341
114
93%
4%
(96)
(3)%
7
974
93
(1.4)
62
235
1,940
1Q22
514
420
573
1,506
24
1,270
212
84%
7%
(357)
(12)%
12
1,040
97
4.8
60
233
1,940
2Q21 Δ 2021
536
4%
473
(14)%
537
(11)%
(7)%
1,547
(24)
1,139
432
74%
13%
770
24%
23
1,158
110
(6.5)
66
241
1,920
18%
(74)%
n/m
(16)
(16)%
(15)%
(6)%
(3)%
1%
Adjusted PTI of CHF 114 mn
includes CHF (55) mn impairments of certain assets¹, CHF (24) mn relating to the
SCFF fee waiver program and CHF (21) mn of MtM losses² in APAC Financing;
reported PTI includes CHF (168) mn of Allfunds valuation losses
Increased net interest income
up 4% YoY and up 9% QoQ due to higher deposit income reflecting higher
interest rates, especially in USD
Commissions and fees decline
reflecting lower AuM at broadly stable recurring margin
Transaction-related revenues decline
as more cautious client sentiment adversely impacted brokerage and structured
product fees
Costs rise from a write-off and investments
CHF (38) mn write-off of certain IT-related assets; higher Group-wide technology,
risk and compliance costs and investments in business growth including China
Moderate net asset outflows
NNA of CHF (1.4) bn driven by outflows from EMEA and Switzerland, with inflows
in APAC and Americas; 1H22 NNA of CHF 3.4 bn; continued client deleveraging
Note: Results excluding certain items in our reported results are non-GAAP financial measures. See the appendix of this presentation for detailed information and defined terms as well as important
presentation and other information relating to non-GAAP financial measures, including reconciliations. 1 Includes CHF (38) mn write-off of certain IT-related assets and CHF (17) mn impairment of
certain third-party assets 2 2022 mark-to-market losses of CHF (21) mn (net of CHF 18 mn of hedges); 2021 included mark-to-market losses of CHF (6) mn (including CHF (4) mn of hedges)
CREDIT SUISSEView entire presentation