Bridge Investment Group Results Presentation Deck
Appendix
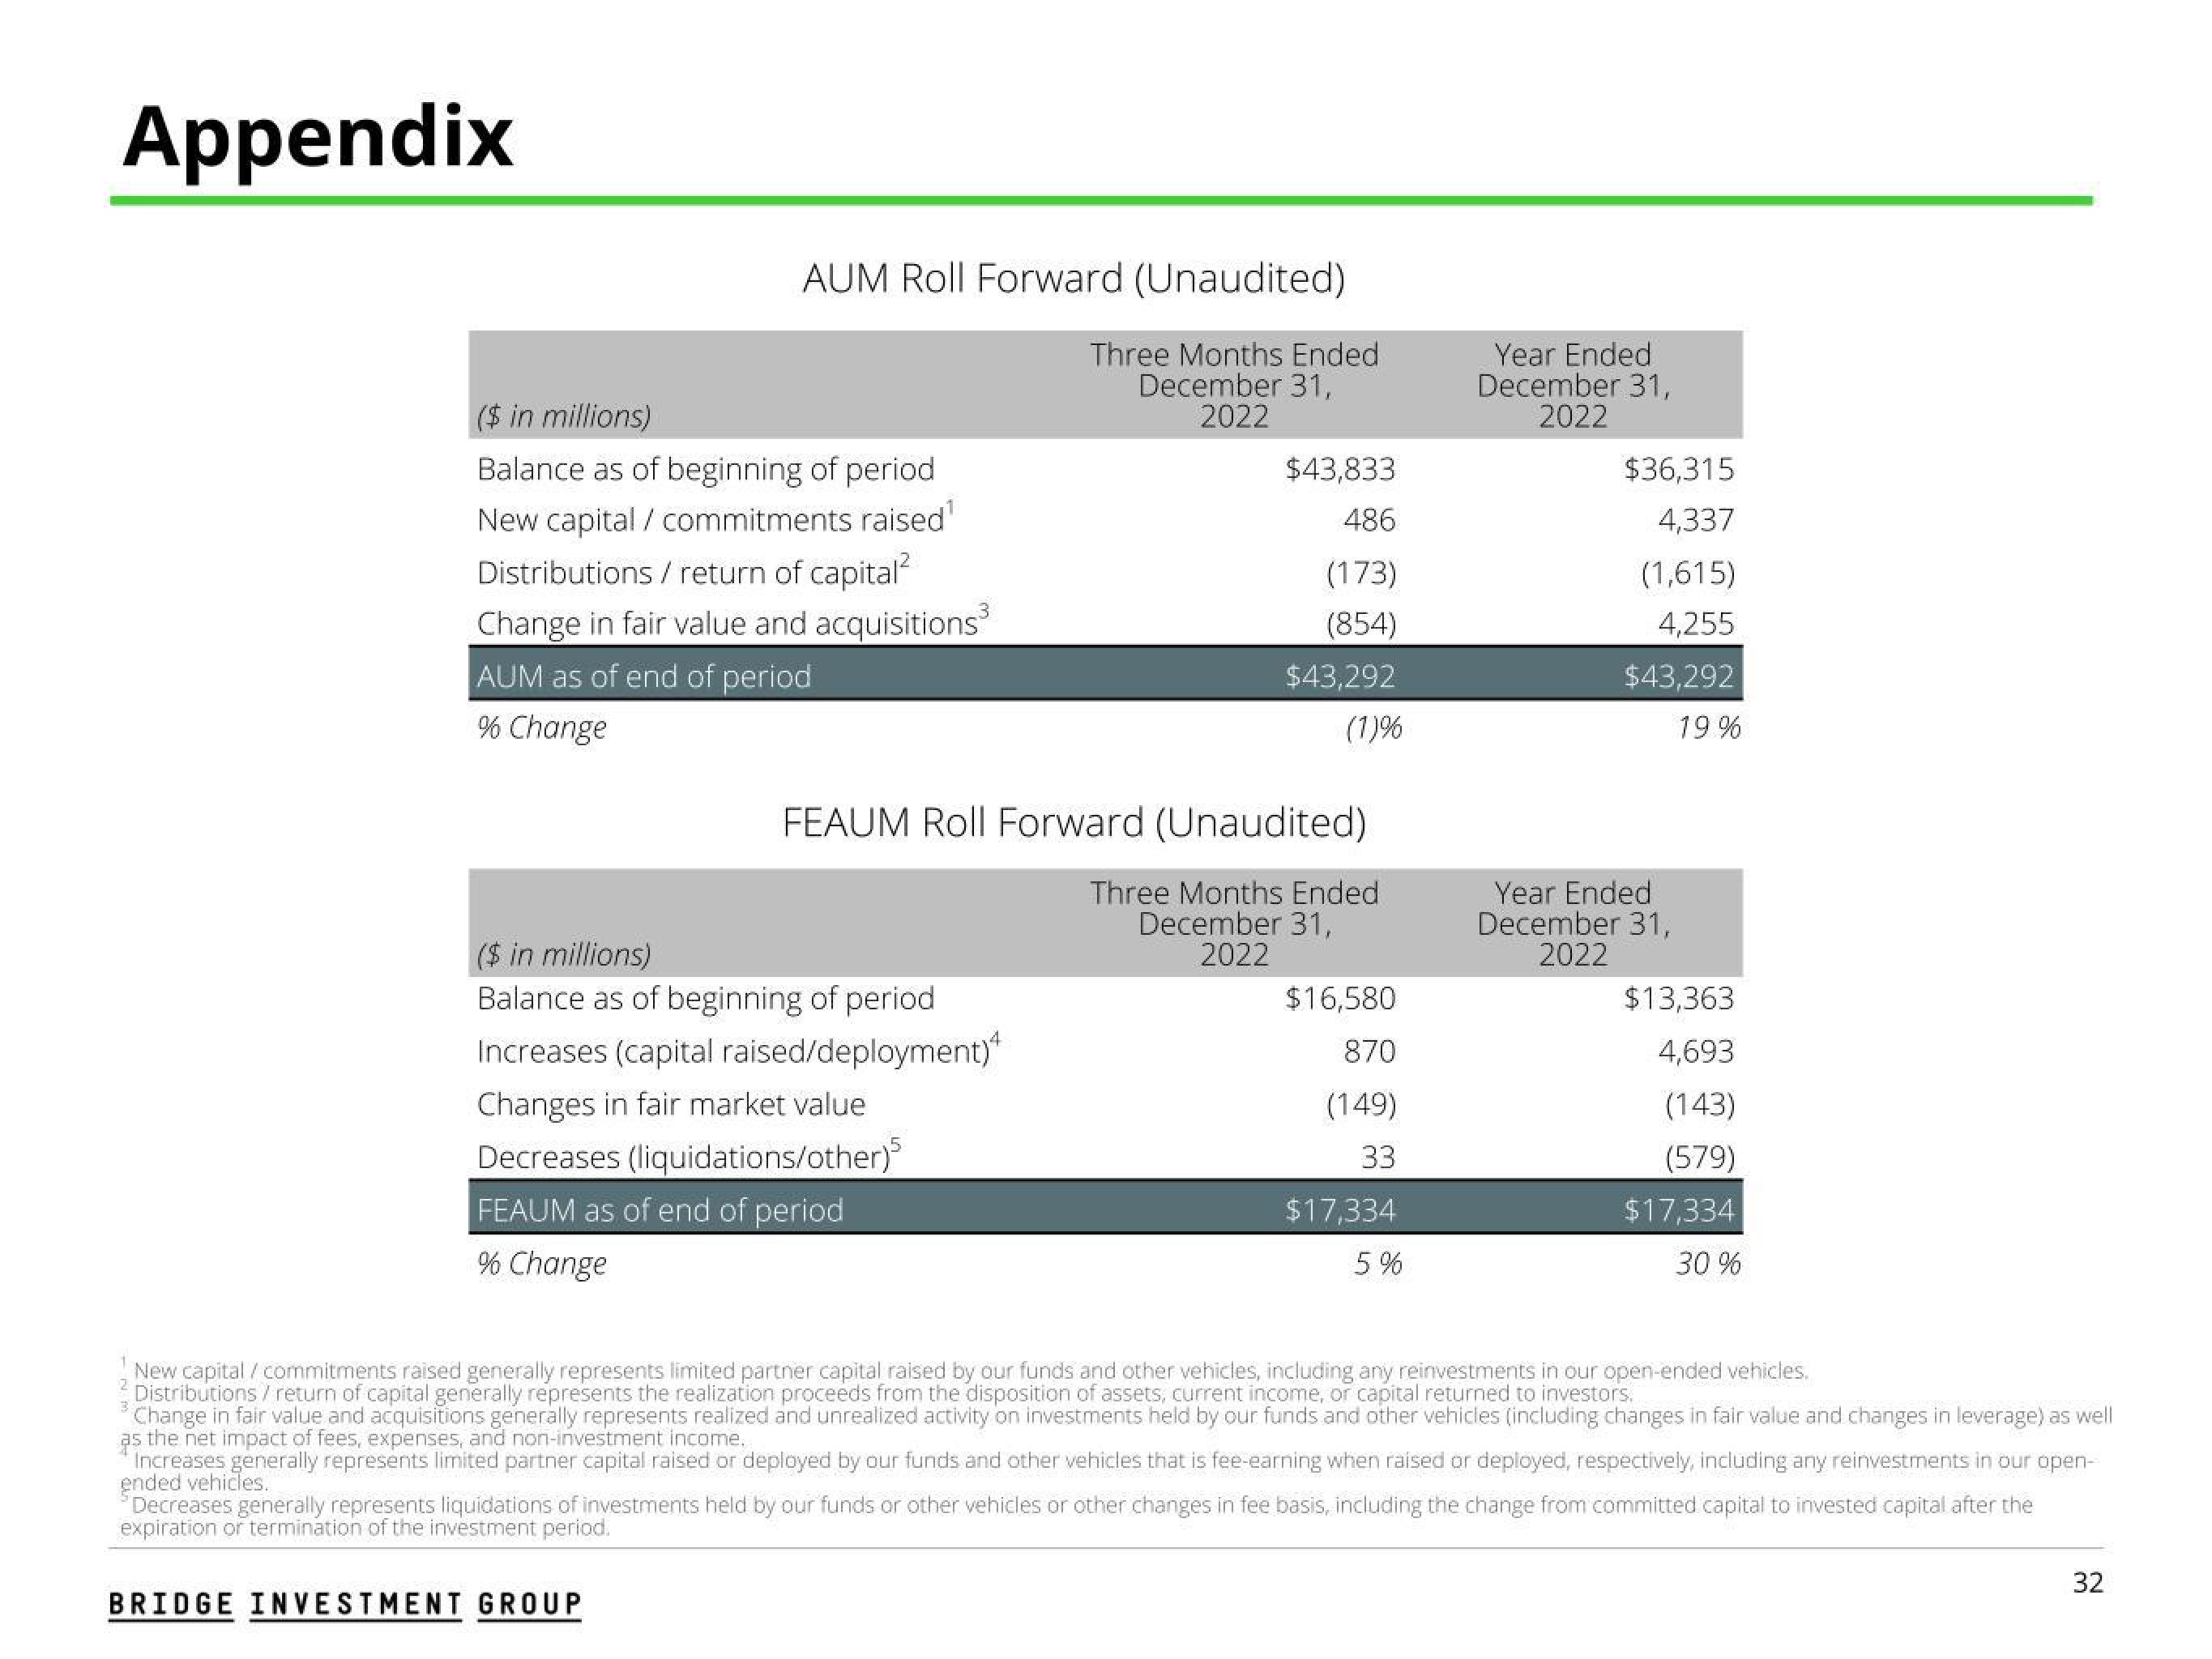
AUM Roll Forward (Unaudited)
Three Months Ended
December 31,
2022
($ in millions)
Balance as of beginning of period
New capital / commitments raised¹
Distributions / return of capital²
Change in fair value and acquisitions³
AUM as of end of period
% Change
($ in millions)
Balance as of beginning of period
FEAUM Roll Forward (Unaudited)
Three Months Ended
December 31,
2022
Increases (capital raised/deployment)
Changes in fair market value
Decreases (liquidations/other)
FEAUM as of end of period
% Change
$43,833
486
(173)
(854)
$43,292
(1)%
BRIDGE INVESTMENT GROUP
$16,580
870
(149)
33
$17,334
5%
Year Ended
December 31,
2022
$36,315
4,337
(1,615)
4,255
$43,292
19%
Year Ended
December 31,
2022
$13,363
4,693
(143)
(579)
$17,334
30 %
New capital / commitments raised generally represents limited partner capital raised by our funds and other vehicles, including any reinvestments in our open-ended vehicles.
Distributions / return of capital generally represents the realization proceeds from the disposition of assets, current income, or capital returned to investors.
Change in fair value and acquisitions generally represents realized and unrealized activity on investments held by our funds and other vehicles (including changes in fair value and changes in leverage) as well
as the net impact of fees, expenses, and non-investment income.
Increases generally represents limited partner capital raised or deployed by our funds and other vehicles that is fee-earning when raised or deployed, respectively, including any reinvestments in our open-
ended vehicles.
Decreases generally represents liquidations of investments held by our funds or other vehicles or other changes in fee basis, including the change from committed capital to invested capital after the
expiration or termination of the investment period.
32View entire presentation