Ashtead Group Results Presentation Deck
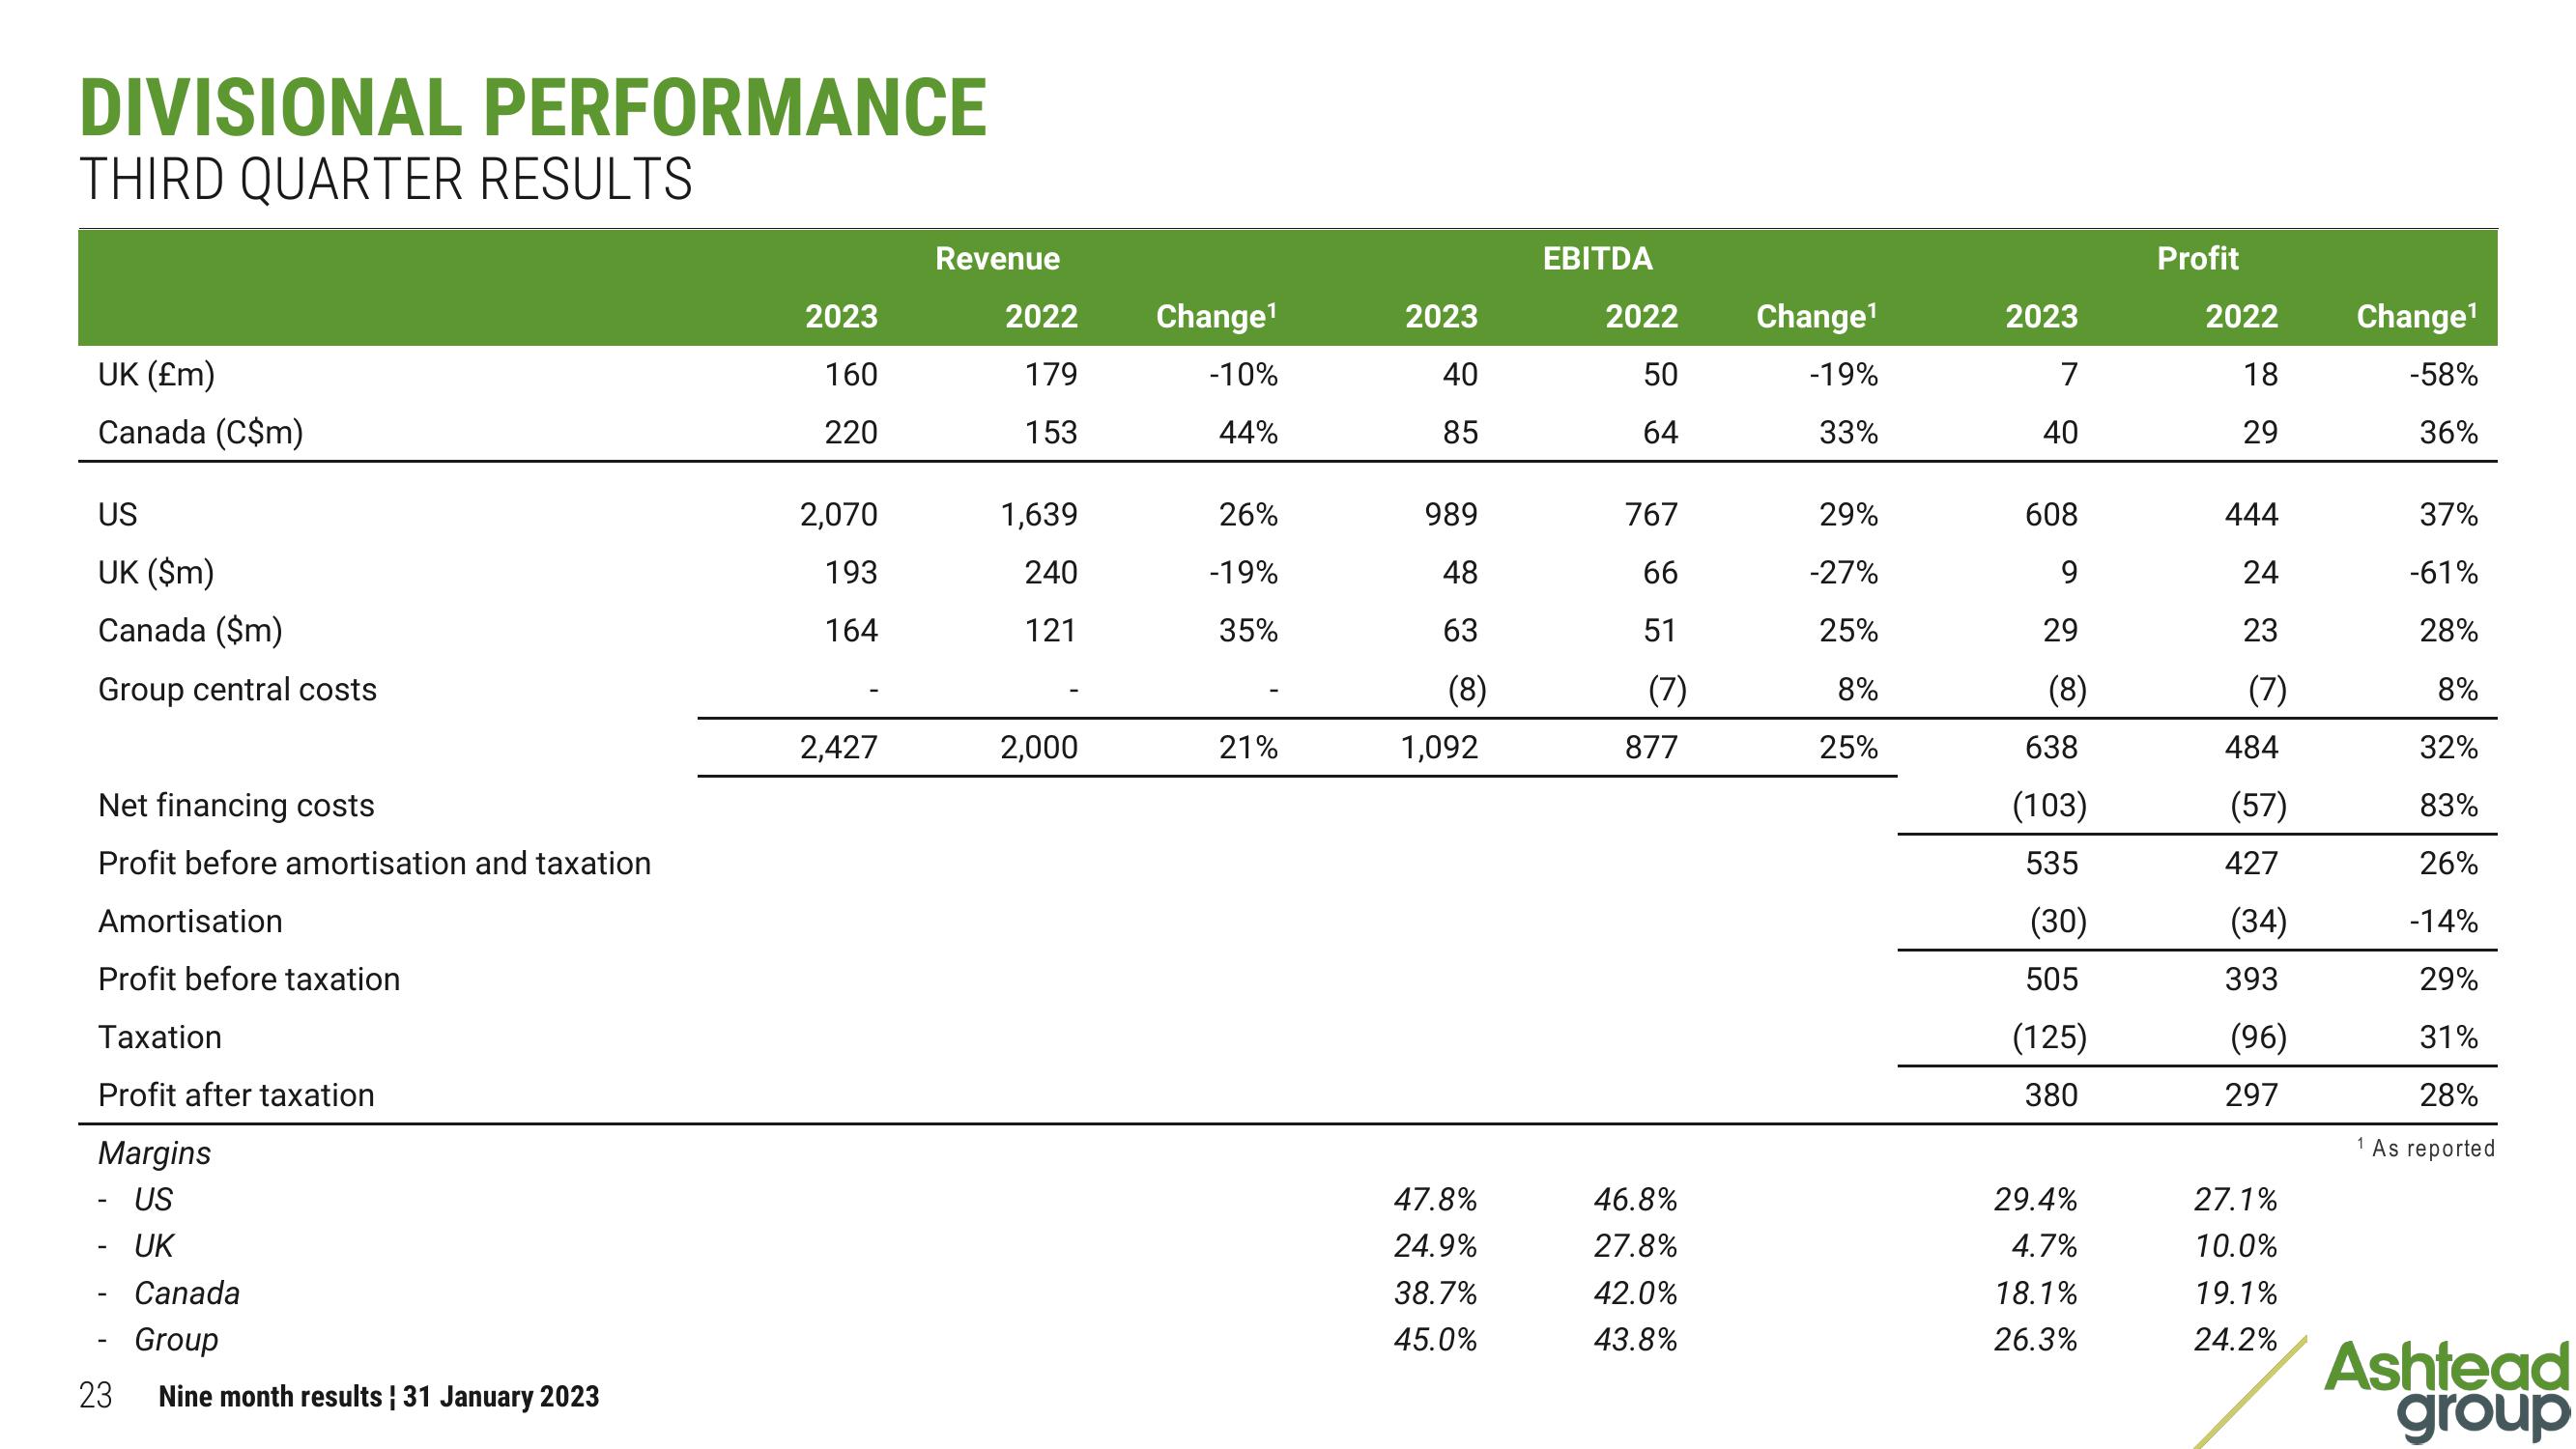
DIVISIONAL PERFORMANCE
THIRD QUARTER RESULTS
UK (£m)
Canada (C$m)
US
UK ($m)
Canada ($m)
Group central costs
Net financing costs
Profit before amortisation and taxation
Amortisation
Profit before taxation
Taxation
Profit after taxation
Margins
US
- UK
23
Canada
Group
Nine month results ¦ 31 January 2023
2023
160
220
2,070
193
164
2,427
Revenue
2022
179
153
1,639
240
121
2,000
Change¹
-10%
44%
26%
-19%
35%
21%
2023
40
85
989
48
63
(8)
1,092
47.8%
24.9%
38.7%
45.0%
EBITDA
2022
50
64
767
66
51
(7)
877
46.8%
27.8%
42.0%
43.8%
Change¹
-19%
33%
29%
-27%
25%
8%
25%
2023
7
40
608
9
29
(8)
638
(103)
535
(30)
505
(125)
380
29.4%
4.7%
18.1%
26.3%
Profit
2022
18
29
444
24
23
(7)
484
(57)
427
(34)
393
(96)
297
27.1%
10.0%
19.1%
24.2%
Change¹
-58%
36%
37%
-61%
28%
8%
32%
83%
26%
-14%
29%
31%
28%
1 As reported
Ashtead
groupView entire presentation