Spotify Results Presentation Deck
Executive Summary
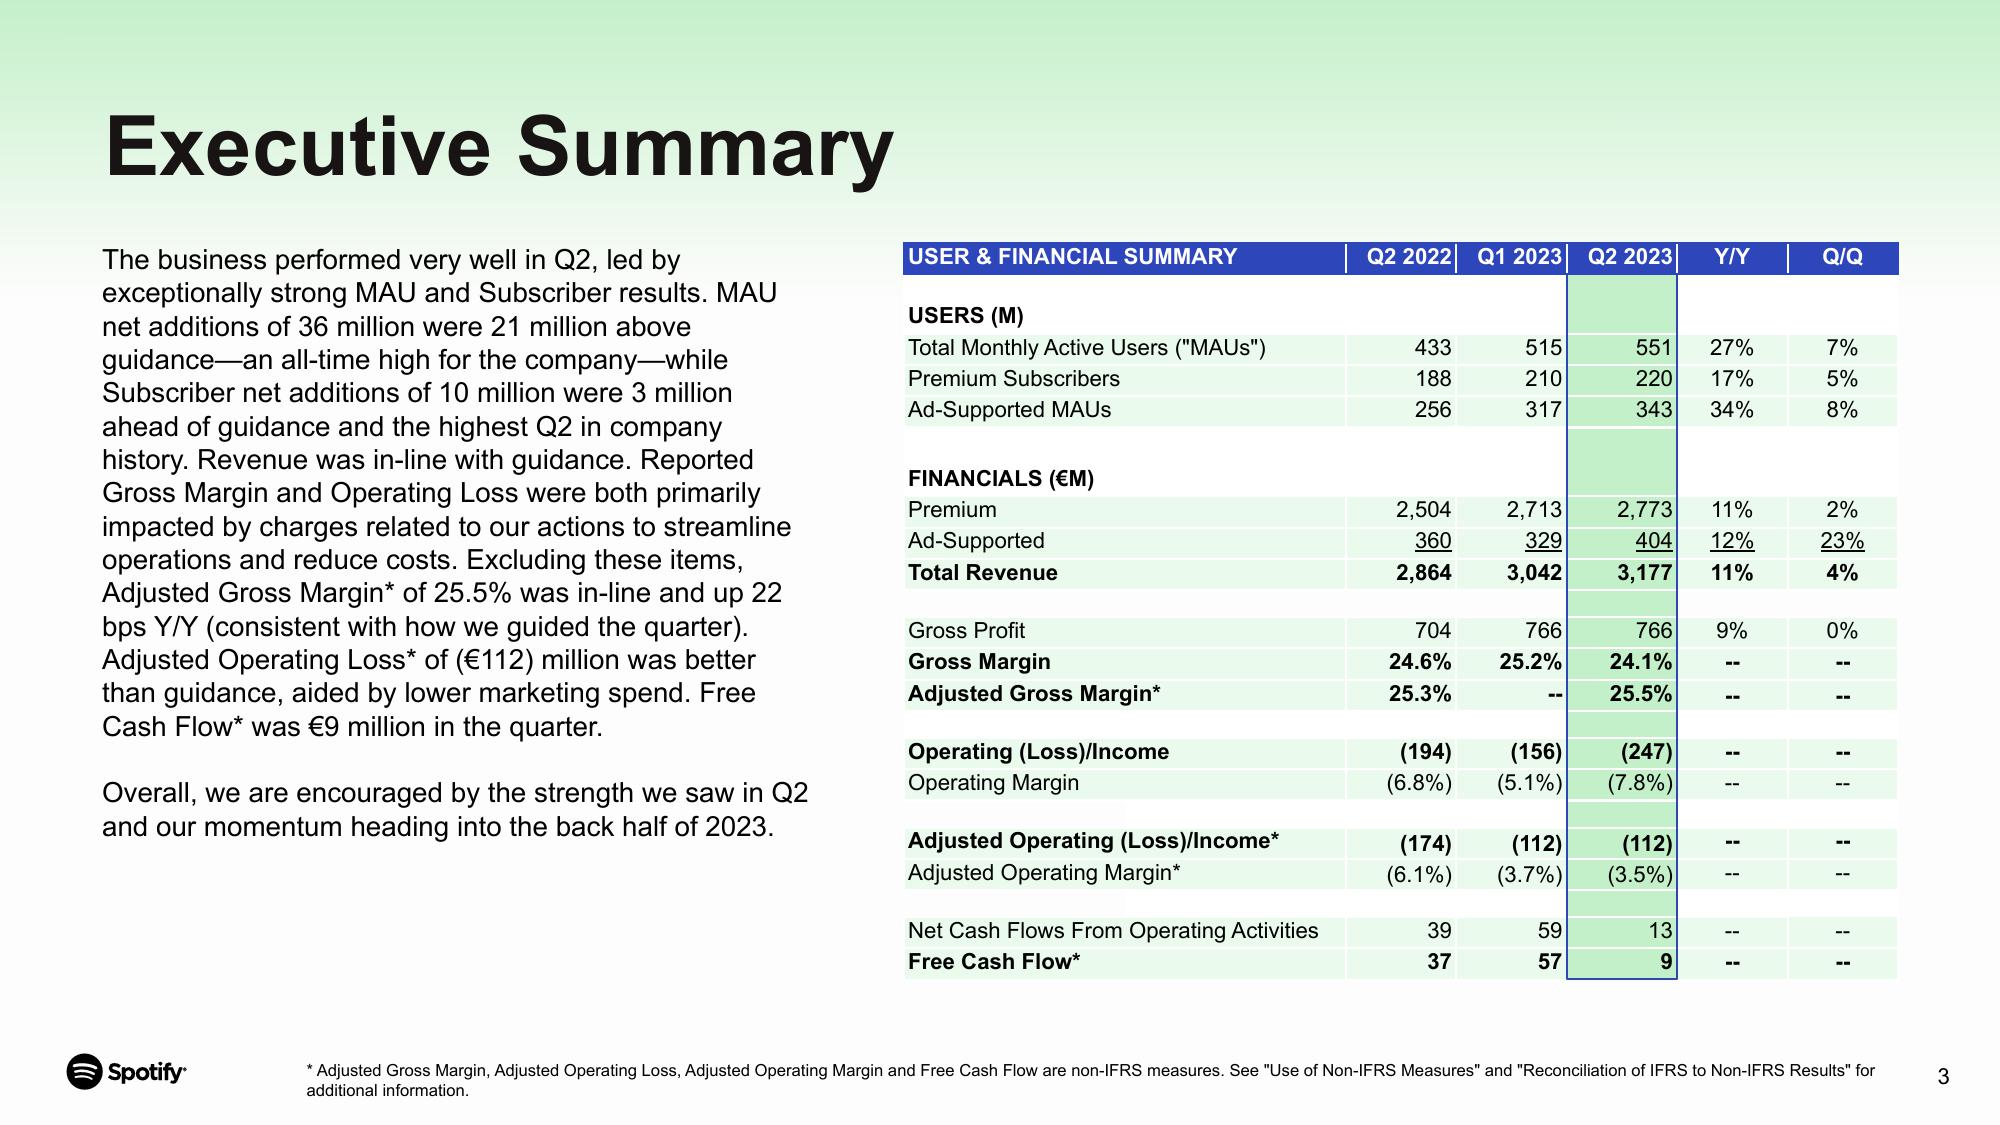
The business performed very well in Q2, led by
exceptionally strong MAU and Subscriber results. MAU
net additions of 36 million were 21 million above
guidance an all-time high for the company-while
Subscriber net additions of 10 million were 3 million
ahead of guidance and the highest Q2 in company
history. Revenue was in-line with guidance. Reported
Gross Margin and Operating Loss were both primarily
impacted by charges related to our actions to streamline
operations and reduce costs. Excluding these items,
Adjusted Gross Margin* of 25.5% was in-line and up 22
bps Y/Y (consistent with how we guided the quarter).
Adjusted Operating Loss* of (€112) million was better
than guidance, aided by lower marketing spend. Free
Cash Flow* was €9 million in the quarter.
Overall, we are encouraged by the strength we saw in Q2
and our momentum heading into the back half of 2023.
Spotify
USER & FINANCIAL SUMMARY
USERS (M)
Total Monthly Active Users ("MAUS")
Premium Subscribers
Ad-Supported MAUS
FINANCIALS (€M)
Premium
Ad-Supported
Total Revenue
Gross Profit
Gross Margin
Adjusted Gross Margin*
Operating (Loss)/Income
Operating Margin
Adjusted Operating (Loss)/Income*
Adjusted Operating Margin*
Net Cash Flows From Operating Activities
Free Cash Flow*
Q2 2022 Q1 2023
433
188
256
2,504
360
2,864
704
24.6%
25.3%
515
210
317
39
37
766
25.2%
--
(194) (156)
(6.8%) (5.1%)
2,713 2,773 11%
404 12%
329
3,042
3,177 11%
(174) (112)
(6.1%) (3.7%)
Q2 2023
59
57
551 27%
220
343
17%
34%
766 9%
24.1%
25.5%
Y/Y
(247)
(7.8%)
(112)
(3.5%)
13
9
--
11
Q/Q
7%
5%
8%
2%
23%
4%
0%
* Adjusted Gross Margin, Adjusted Operating Loss, Adjusted Operating Margin and Free Cash Flow are non-IFRS measures. See "Use of Non-IFRS Measures" and "Reconciliation of IFRS to Non-IFRS Results" for
additional information.
3View entire presentation