Bank of America Results Presentation Deck
Consumer Banking Trends
Business Leadership¹
• No. 1 in estimated U.S. Retail Deposits(A)
.
• No. 1 Online Banking and Mobile Banking
.
Functionality (B)
.
.
Best Bank in the U.S. (E)
• Best Consumer Digital Bank in the U.S.(F)
Certified by J.D. Power for providing
outstanding client satisfaction for financial
wellness support(G)
No. 1 in customer satisfaction with
Merchant Services by J.D. Power(C)
No. 1 Small Business Lender (D)
.
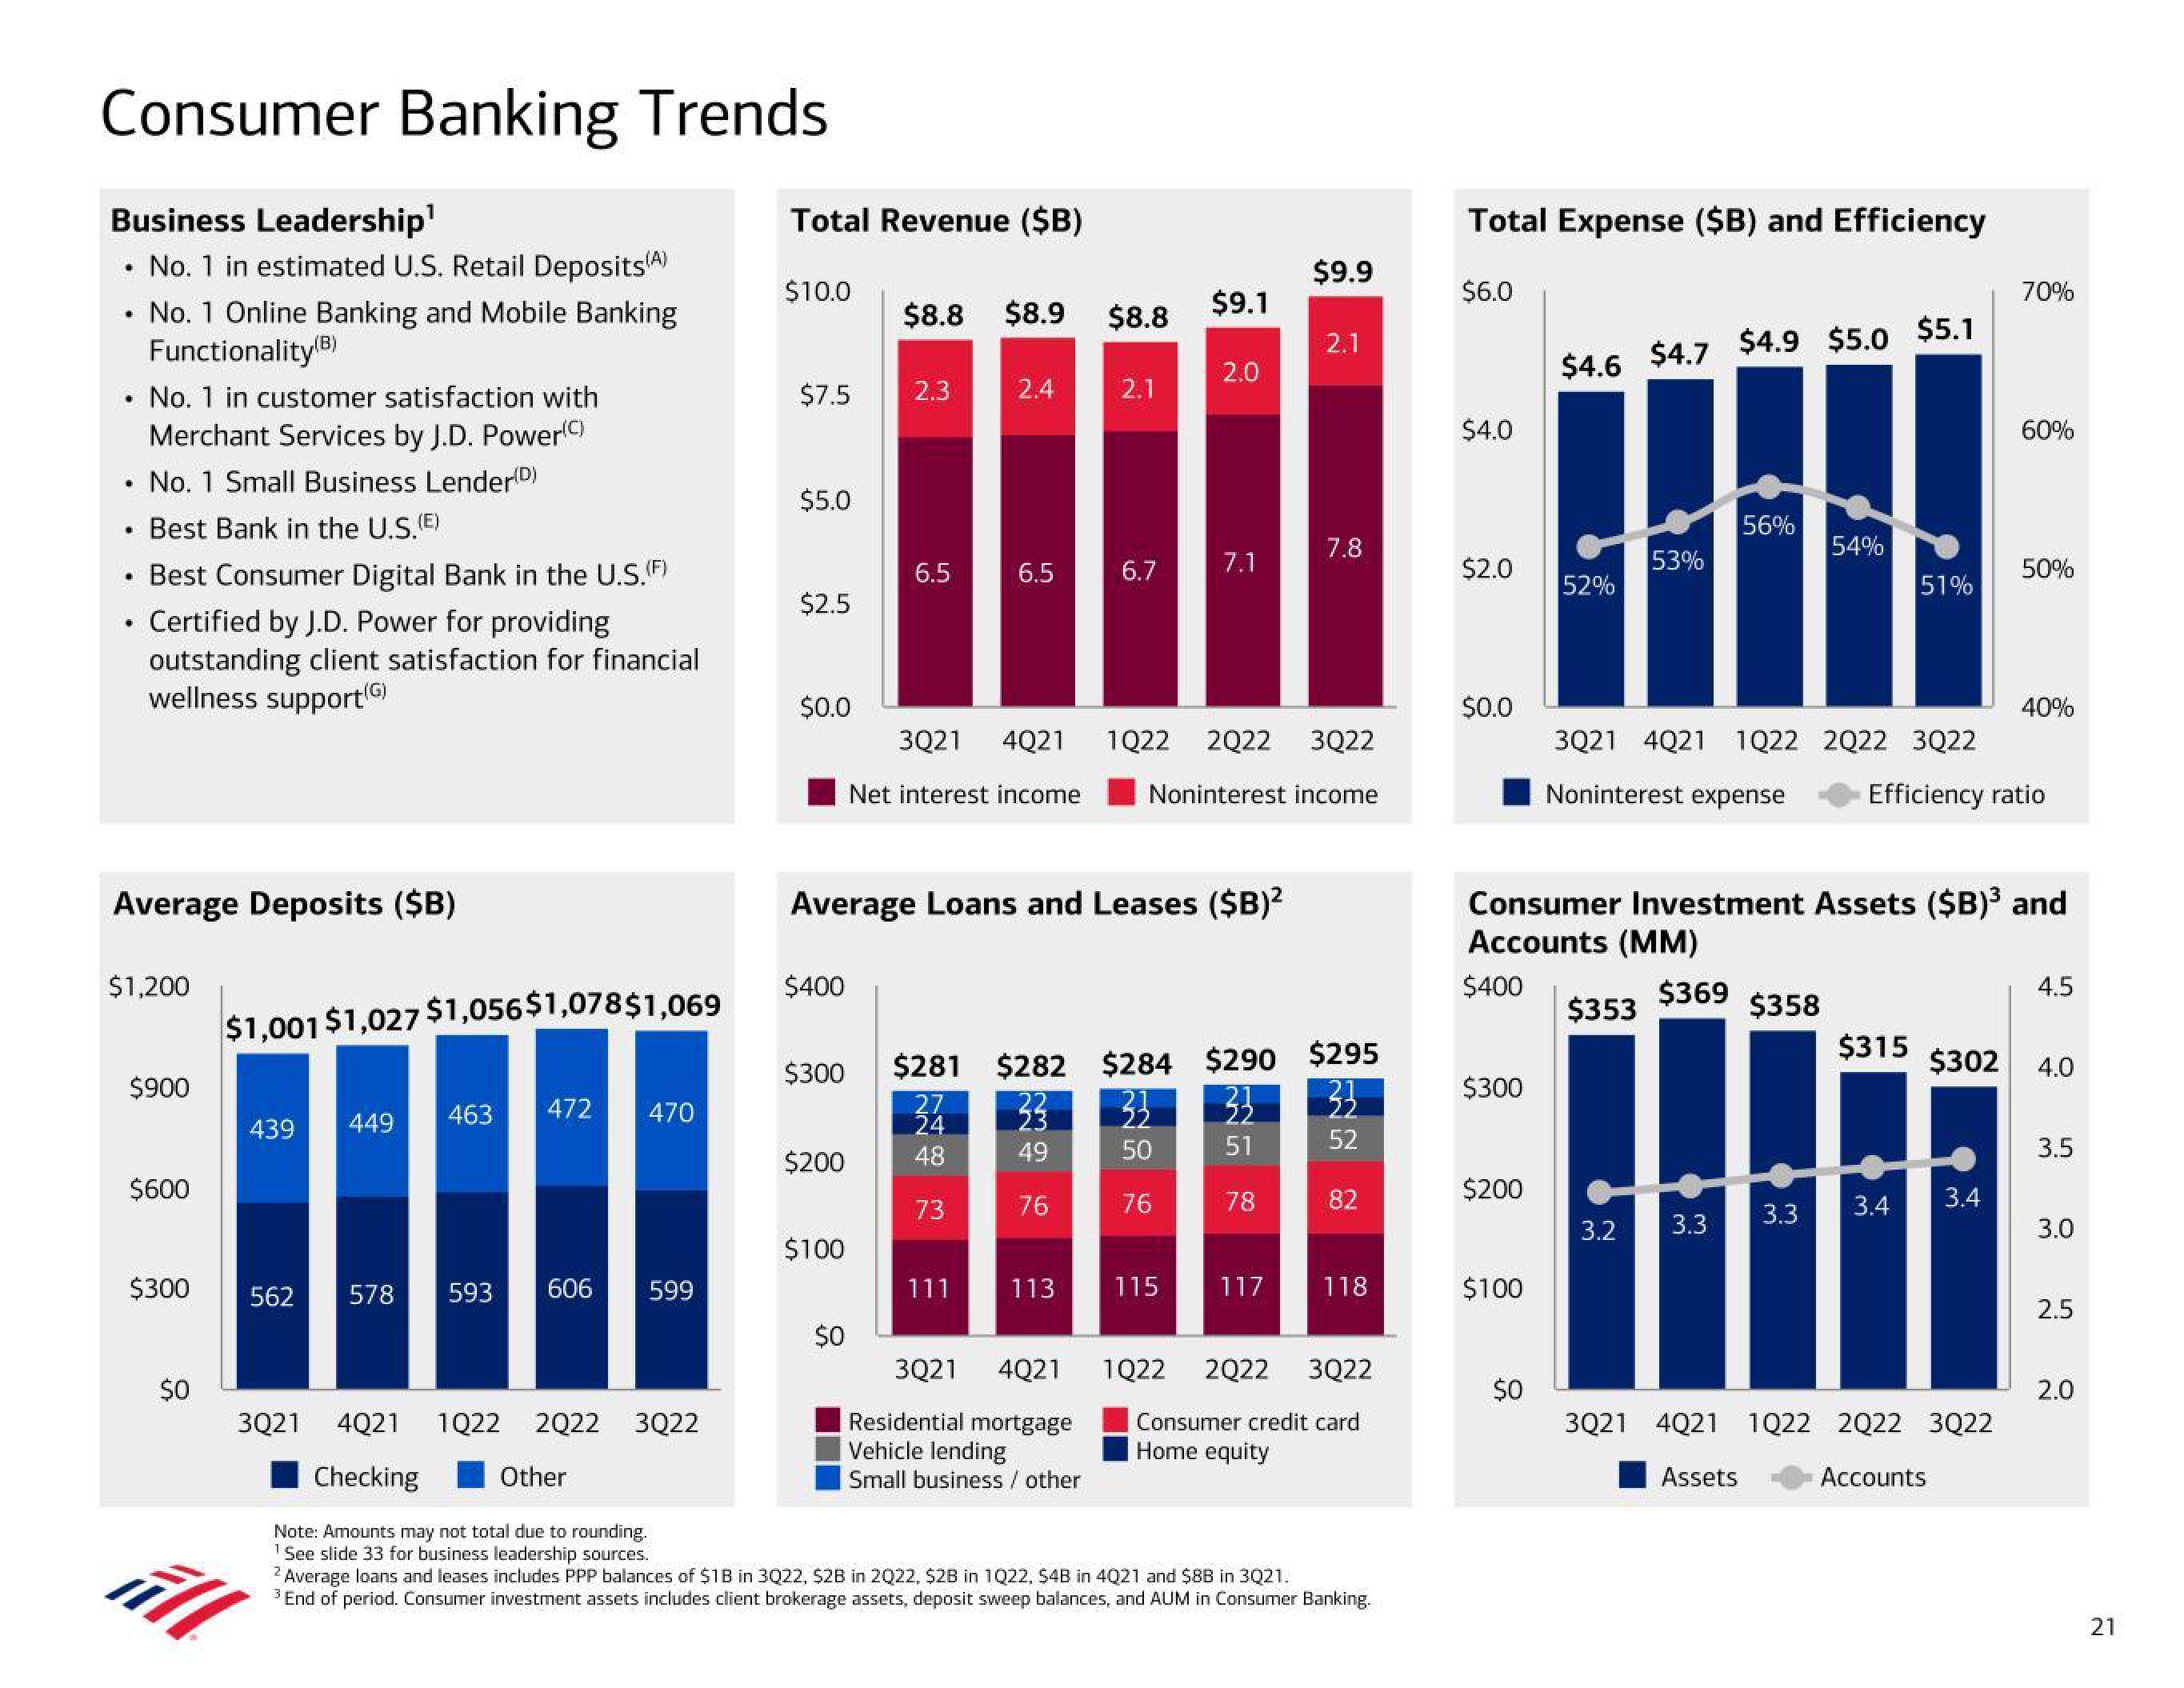
Average Deposits ($B)
$1,200
$900
$600
$300
$0
$1,001 $1,027 $1,056$1,078$1,069
439
449
463
472
470
562 578 593 606 599
3Q21 4Q21 1Q22 2Q22 3Q22
Checking
Note: Amounts may not total due to rounding.
1 See slide 33 for business leadership sources.
Other
Total Revenue ($B)
$10.0
$7.5
$5.0
$2.5
$0.0
$400
$300
$200
$100
$8.8 $8.9
$0
2.3
6.5
2.4
6.5
Net interest income
111
Average Loans and Leases ($B)²
$8.8
33
49
76
2.1
113
6.7
3Q21 4Q21
Residential mortgage
Vehicle lending
Small business / other
3Q21 4Q21 1Q22 2Q22 3Q22
Noninterest income
$9.1
2.0
33
50
76
7.1
$281 $282 $284 $290 $295
27
33
24
52
48
73
115
$9.9
2.1
33
51
78
7.8
82
117 118
1Q22 2Q22 3Q22
Consumer credit card
Home equity
2 Average loans and leases includes PPP balances of $1B in 3Q22, $2B in 2022, $2B in 1Q22, $4B in 4Q21 and $8B in 3Q21.
3 End of period. Consumer investment assets includes client brokerage assets, deposit sweep balances, and AUM in Consumer Banking.
Total Expense ($B) and Efficiency
$6.0
$4.0
$2.0
$0.0
$300
$200
$100
$4.6 $4.7
$0
52%
53%
$353
3Q21 4021 1022
Noninterest expense
3.2
$4.9 $5.0 $5.1
56%
3.3
Consumer Investment Assets ($B)³ and
Accounts (MM)
$400
$369
54%
51%
$358
$315
|||
3.3
3.4
2022 3Q22
Efficiency ratio
$302
70%
3.4
60%
3Q21 4021 1022 2022 3Q22
Assets
Accounts
50%
40%
4.5
4.0
3.5
3.0
2.5
2.0
21View entire presentation