Pathward Financial Results Presentation Deck
FEE INCOME DRIVES PROFITABILITY
SECOND QUARTER ENDED MARCH 31, 2021
"
6
INCOME STATEMENT
($ in thousands, except per share data)
Net interest income
Provision for credit losses
Payments card & deposit fees
Tax product fee income
Total noninterest income
Total noninterest expense
Net income before taxes
Income tax expense
Net income before non-controlling interest
Net income attributable to non-controlling interest
Net income attributable to parent
Less: Allocation of earnings to participating securities¹
Net income attributable to common shareholders ¹
Earnings per share, diluted
Average diluted shares
1 Amounts presented are used in the two-class earnings per common share calculation.
$
2Q21
73,850
30,290
29,875
67,242
113,453
95,971
61,042
1,133
59,909
843
59,066 $
1,113
57,953
1.84 $
31,535,022
1Q21
65,999
6,089
22,564
2,607
45,455
72,575
32,790
3,533
29,257
1,220
28,037 $
554
27,483
0.84
32,790,895
$
2Q20
67,737
37,296
23,156
58,475
120,513
91,729
59,225
5,617
53,608
1,304
52,304
1,215
51,089
1.45
35,135,550
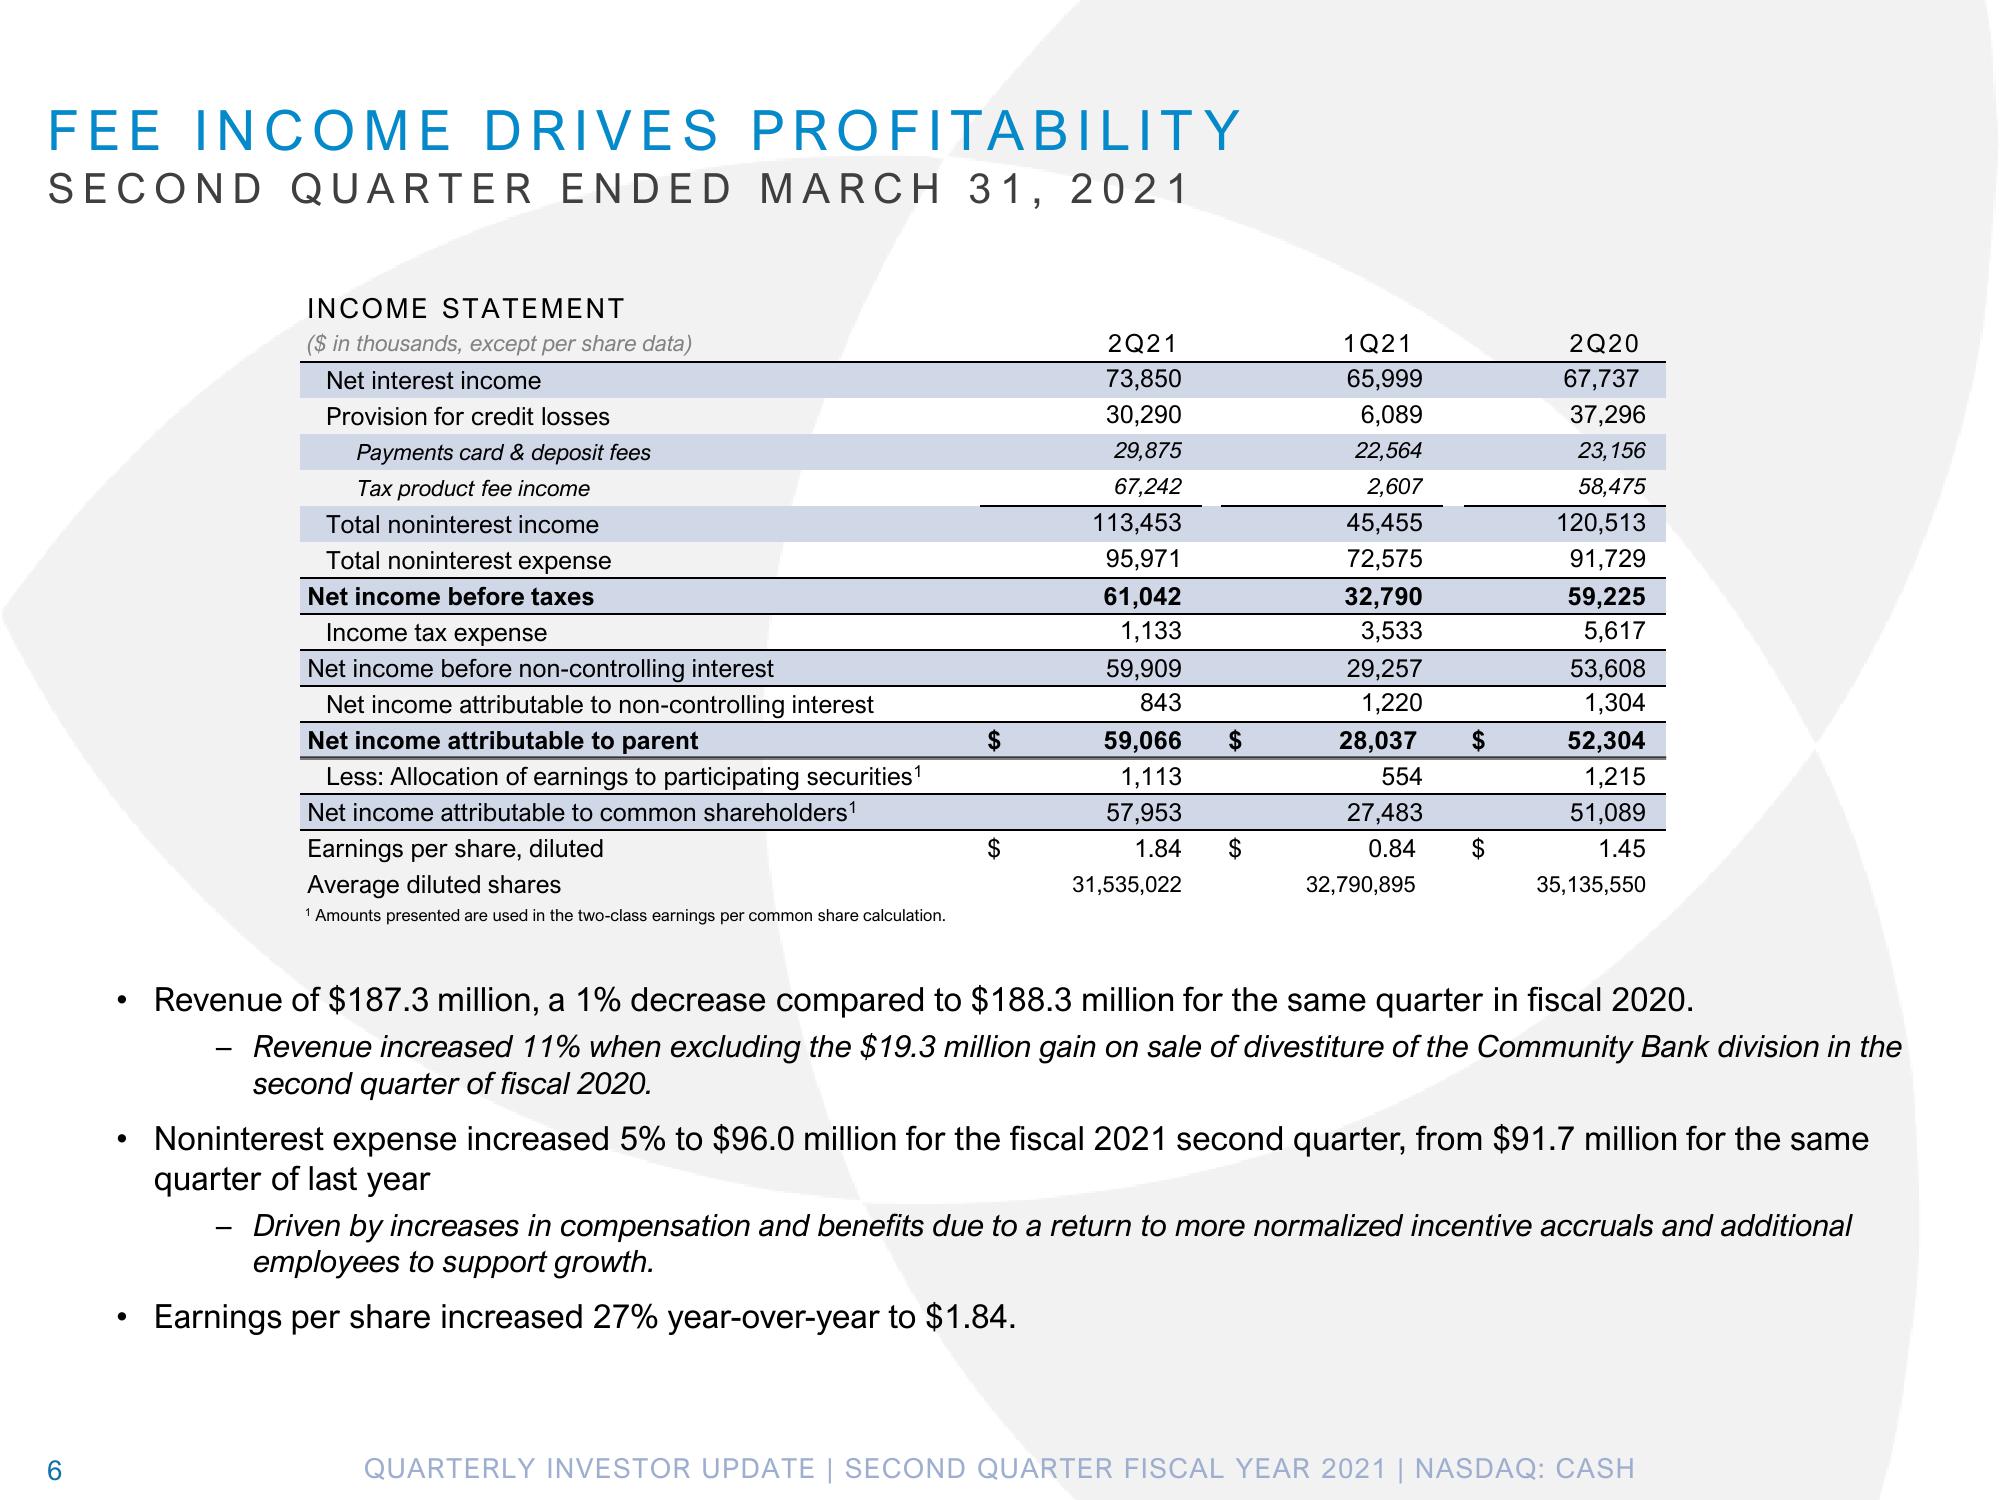
Revenue of $187.3 million, a 1% decrease compared to $188.3 million for the same quarter in fiscal 2020.
Revenue increased 11% when excluding the $19.3 million gain on sale of divestiture of the Community Bank division in the
second quarter of fiscal 2020.
Noninterest expense increased 5% to $96.0 million for the fiscal 2021 second quarter, from $91.7 million for the same
quarter of last year
Driven by increases in compensation and benefits due to a return to more normalized incentive accruals and additional
employees to support growth.
Earnings per share increased 27% year-over-year to $1.84.
QUARTERLY INVESTOR UPDATE | SECOND QUARTER FISCAL YEAR 2021 | NASDAQ: CASHView entire presentation