Marti Results Presentation Deck
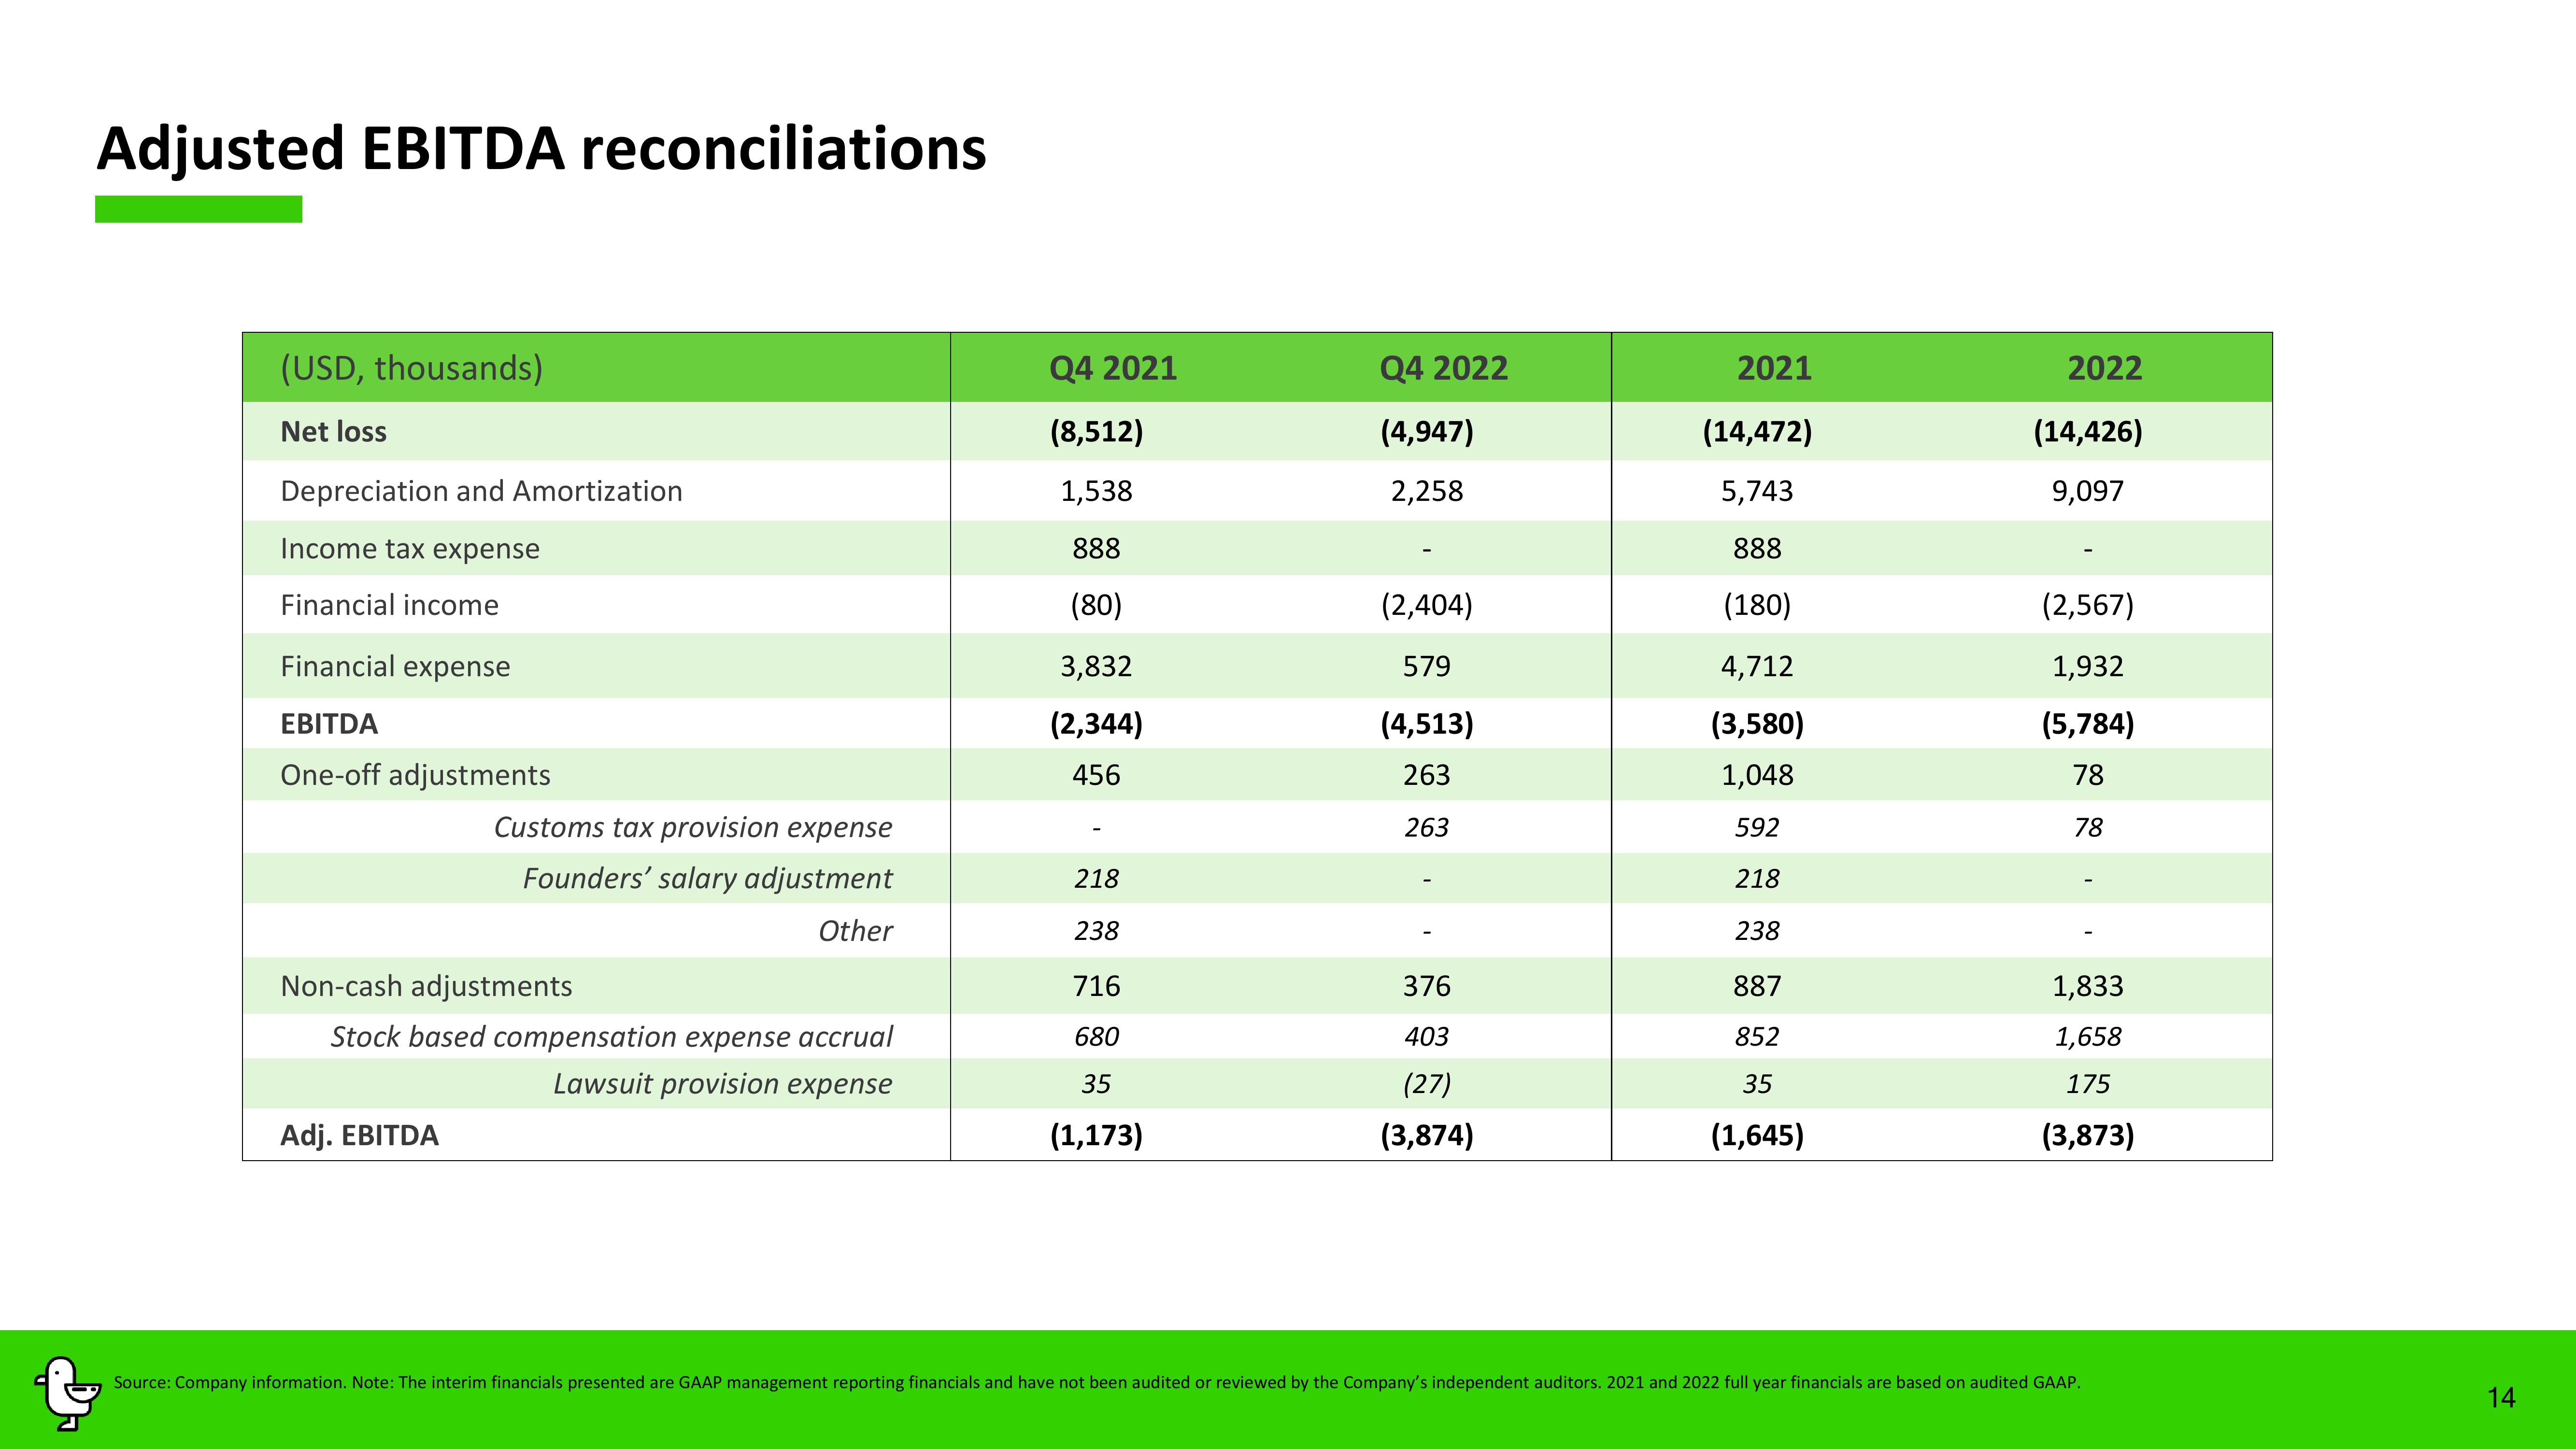
Adjusted EBITDA reconciliations
(USD, thousands)
Net loss
Depreciation and Amortization
Income tax expense
Financial income
Financial expense
EBITDA
One-off adjustments
Customs tax provision expense
Founders' salary adjustment
Other
Non-cash adjustments
Stock based compensation expense accrual
Lawsuit provision expense
Adj. EBITDA
Q4 2021
(8,512)
1,538
888
(80)
3,832
(2,344)
456
218
238
716
680
35
(1,173)
Q4 2022
(4,947)
2,258
(2,404)
579
(4,513)
263
263
376
403
(27)
(3,874)
2021
(14,472)
5,743
888
(180)
4,712
(3,580)
1,048
592
218
238
887
852
35
(1,645)
2022
(14,426)
9,097
(2,567)
1,932
(5,784)
78
78
1,833
1,658
175
(3,873)
Source: Company information. Note: The interim financials presented are GAAP management reporting financials and have not been audited or reviewed by the Company's independent auditors. 2021 and 2022 full year financials are based on audited GAAP.
14View entire presentation