dLocal Results Presentation Deck
Sustained growth
rates in Pay-ins
and Pay-outs
Continuous TPV
expansion across
services
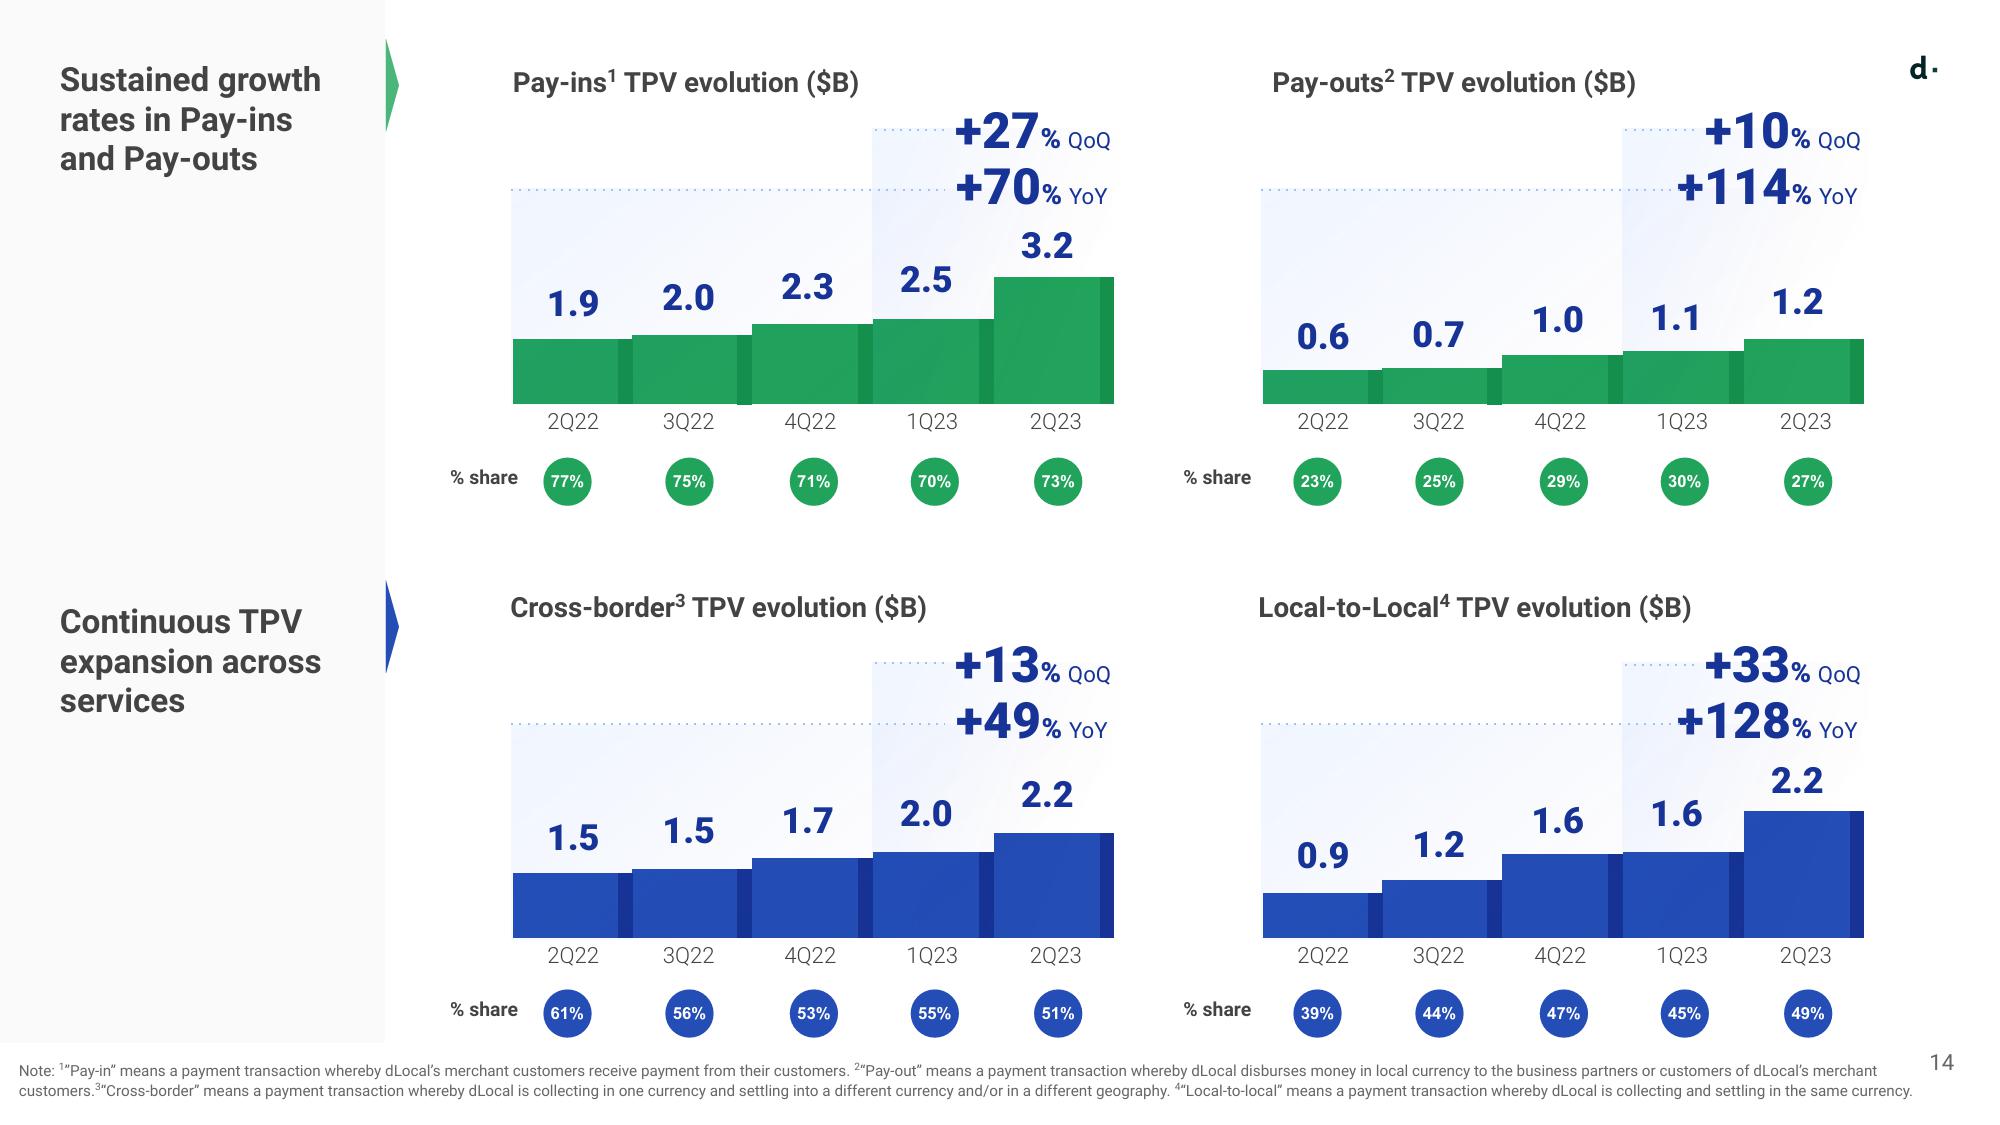
Pay-ins¹ TPV evolution ($B)
1.9 2.0
2022
% share 77%
1.5
2022
3Q22
% share 61%
75%
1.5
3Q22
2.3
Cross-border³ TPV evolution ($B)
56%
4Q22
71%
1.7
4Q22
53%
2.5
1Q23
70%
+27% QOQ
+70% YOY
3.2
2.0
55%
1Q23
2Q23
+13% QOQ
+49% YOY
2.2
73%
2Q23
51%
% share
% share
Pay-outs² TPV evolution ($B)
0.6
2Q22
23%
0.9
2Q22
0.7
39%
3Q22
25%
1.2
3Q22
1.0
44%
4Q22
Local-to-Local4 TPV evolution ($B)
29%
1.6
4Q22
+10% QOQ
+114% YOY
47%
1.1
1Q23
30%
1.6
1Q23
1.2
+33% QOQ
+128% YOY
2.2
45%
2Q23
27%
2Q23
49%
d.
Note: ¹"Pay-in" means a payment transaction whereby dLocal's merchant customers receive payment from their customers. 2"Pay-out" means a payment transaction whereby dLocal disburses money in local currency to the business partners or customers of dLocal's merchant
customers.³"Cross-border" means a payment transaction whereby dLocal is collecting in one currency and settling into a different currency and/or in a different geography. 4"Local-to-local" means a payment transaction whereby dLocal is collecting and settling in the same currency.
14View entire presentation