GMS Investor Presentation Deck
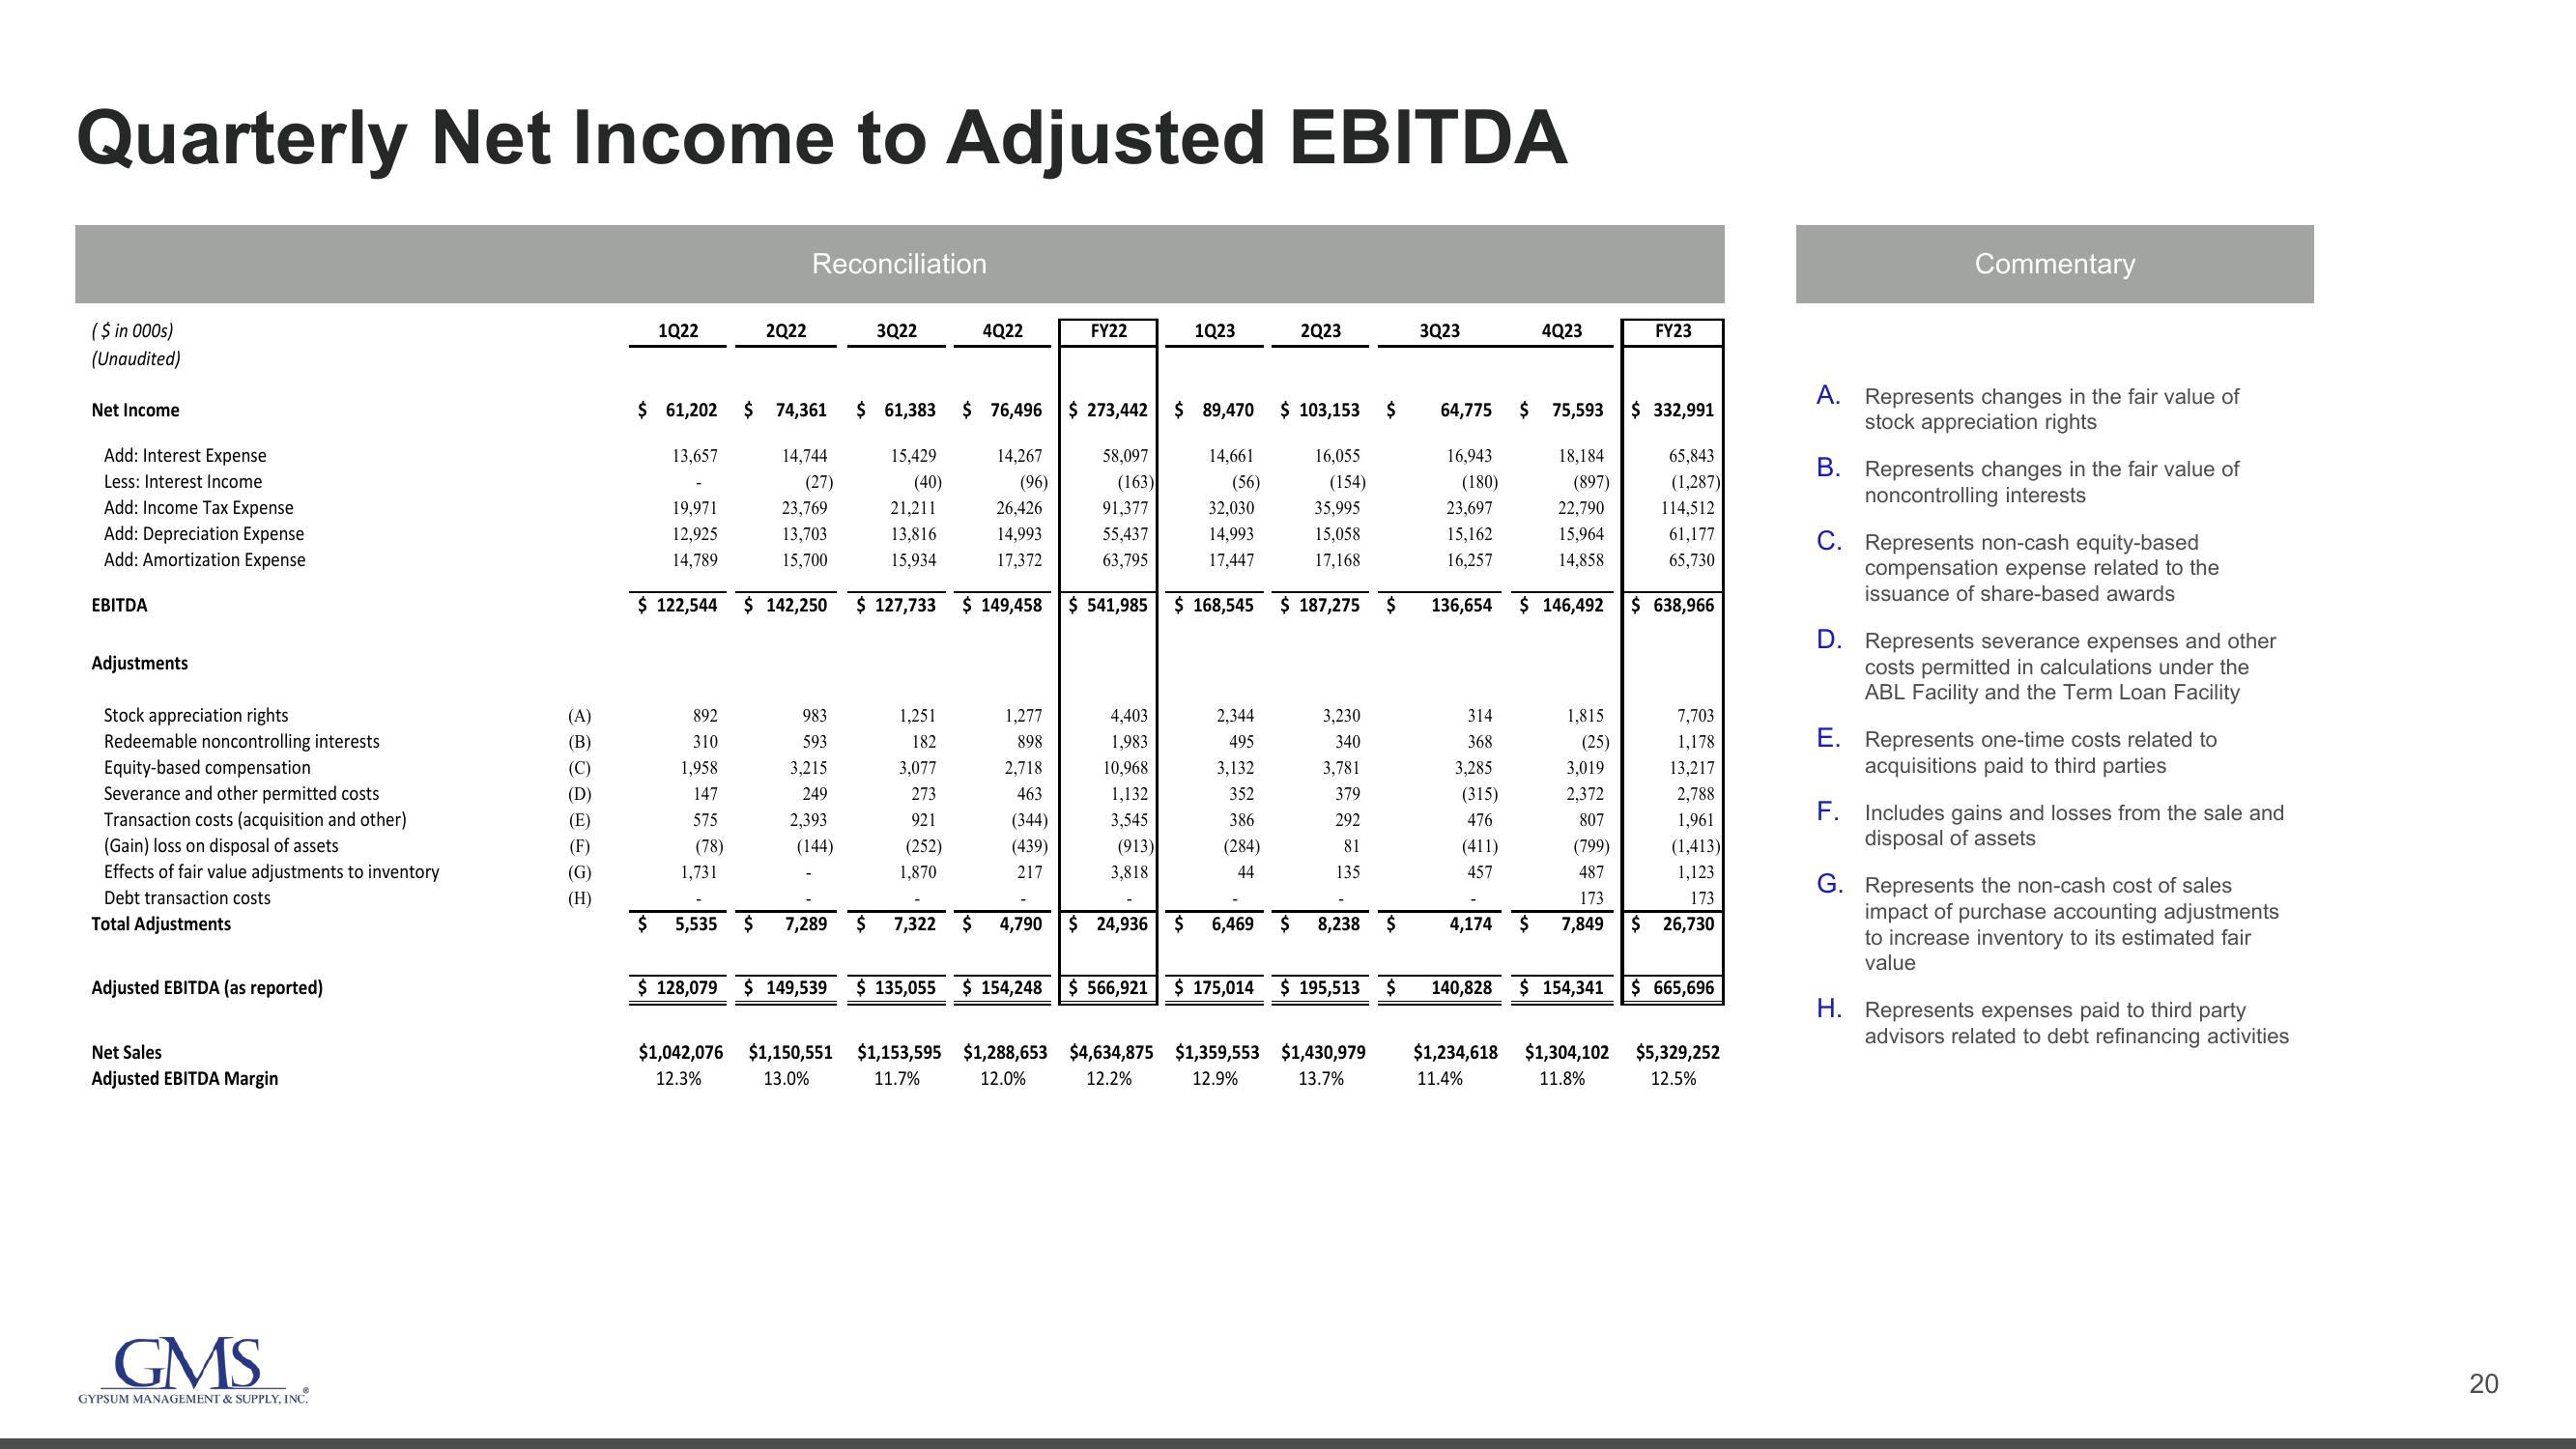
Quarterly Net Income to Adjusted EBITDA
($ in 000s)
(Unaudited)
Net Income
Add: Interest Expense
Less: Interest Income
Add: Income Tax Expense
Add: Depreciation Expense
Add: Amortization Expense
EBITDA
Adjustments
Stock appreciation rights
Redeemable noncontrolling interests
Equity-based compensation
Severance and other permitted costs
Transaction costs (acquisition and other)
(Gain) loss on disposal of assets
Effects of fair value adjustments to inventory
Debt transaction costs
Total Adjustments
Adjusted EBITDA (as reported)
Net Sales
Adjusted EBITDA Margin
GMS
GYPSUM MANAGEMENT & SUPPLY, INC.
(A)
(B)
(C)
(D)
(E)
(F)
(G)
(H)
1Q22
13,657
19,971
12,925
14,789
892
310
1,958
147
575
(78)
2Q22
$ 61,202 $ 74,361 $ 61,383 $ 76,496
15,429
14,744
(27)
23,769
(40)
21,211
13,703
13,816
15,700
15,934
$ 122,544 $ 142,250 $ 127,733
1,731
Reconciliation
983
593
3,215
249
2,393
(144)
$ 5,535 $ 7,289
$ 128,079 $ 149,539
3Q22
$
1,251
182
3,077
273
921
(252)
4Q22
1,870
14,267
(96)
26,426
14,993
17,372
$ 149,458
1,277
898
2,718
463
(344)
(439)
217
7,322 $ 4,790
$ 135,055 $ 154,248
FY22
$ 273,442
58,097
(163)
91,377
55,437
63,795
$ 541,985
4,403
1,983
10,968
1,132
3,545
(913)
3,818
$ 24,936
1Q23
$ 89,470 $ 103,153 $
14,661
(56)
32,030
14,993
17,447
2Q23
2,344
495
3,132
352
386
(284)
44
16,055
35,995
15,058
17,168
$ 168,545 $ 187,275 $
$ 566,921 $ 175,014
(154)
3,230
340
3,781
379
292
81
135
$ 6,469 $ 8,238 $
$ 195,513
$1,042,076 $1,150,551 $1,153,595 $1,288,653 $4,634,875 $1,359,553 $1,430,979
12.3%
13.0%
11.7%
12.0%
12.2%
12.9%
13.7%
$
3Q23
64,775
16,943
(180)
23,697
15,162
16,257
136,654
314
368
3,285
(315)
476
(411)
457
4Q23
$ 75,593
18,184
(897)
22,790
15,964
14,858
$ 146,492
1,815
(25)
3,019
2,372
807
(799)
487
173
4,174 $ 7,849
FY23
$ 332,991
65,843
(1,287)
114,512
61,177
65,730
$ 638,966
7,703
1,178
13,217
2,788
1,961
(1,413)
1,123
173
$ 26,730
140,828 $ 154,341 $ 665,696
$1,234,618 $1,304,102 $5,329,252
11.4%
11.8%
12.5%
Commentary
A. Represents changes in the fair value of
stock appreciation rights
B. Represents changes in the fair value of
noncontrolling interests
C. Represents non-cash equity-based
compensation expense related to the
issuance of share-based awards
D. Represents severance expenses and other
costs permitted in calculations under the
ABL Facility and the Term Loan Facility
E. Represents one-time costs related to
acquisitions paid to third parties
F.
Includes gains and losses from the sale and
disposal of assets
G. Represents the non-cash cost of sales
impact of purchase accounting adjustments
to increase inventory to its estimated fair
value
H. Represents expenses paid to third party
advisors related to debt refinancing activities
20View entire presentation