Truist Financial Corp Results Presentation Deck
Corporate & Commercial Banking
Represents performance for Commercial Community Banking, Corporate & Investment Banking, and CRE & Grandbridge
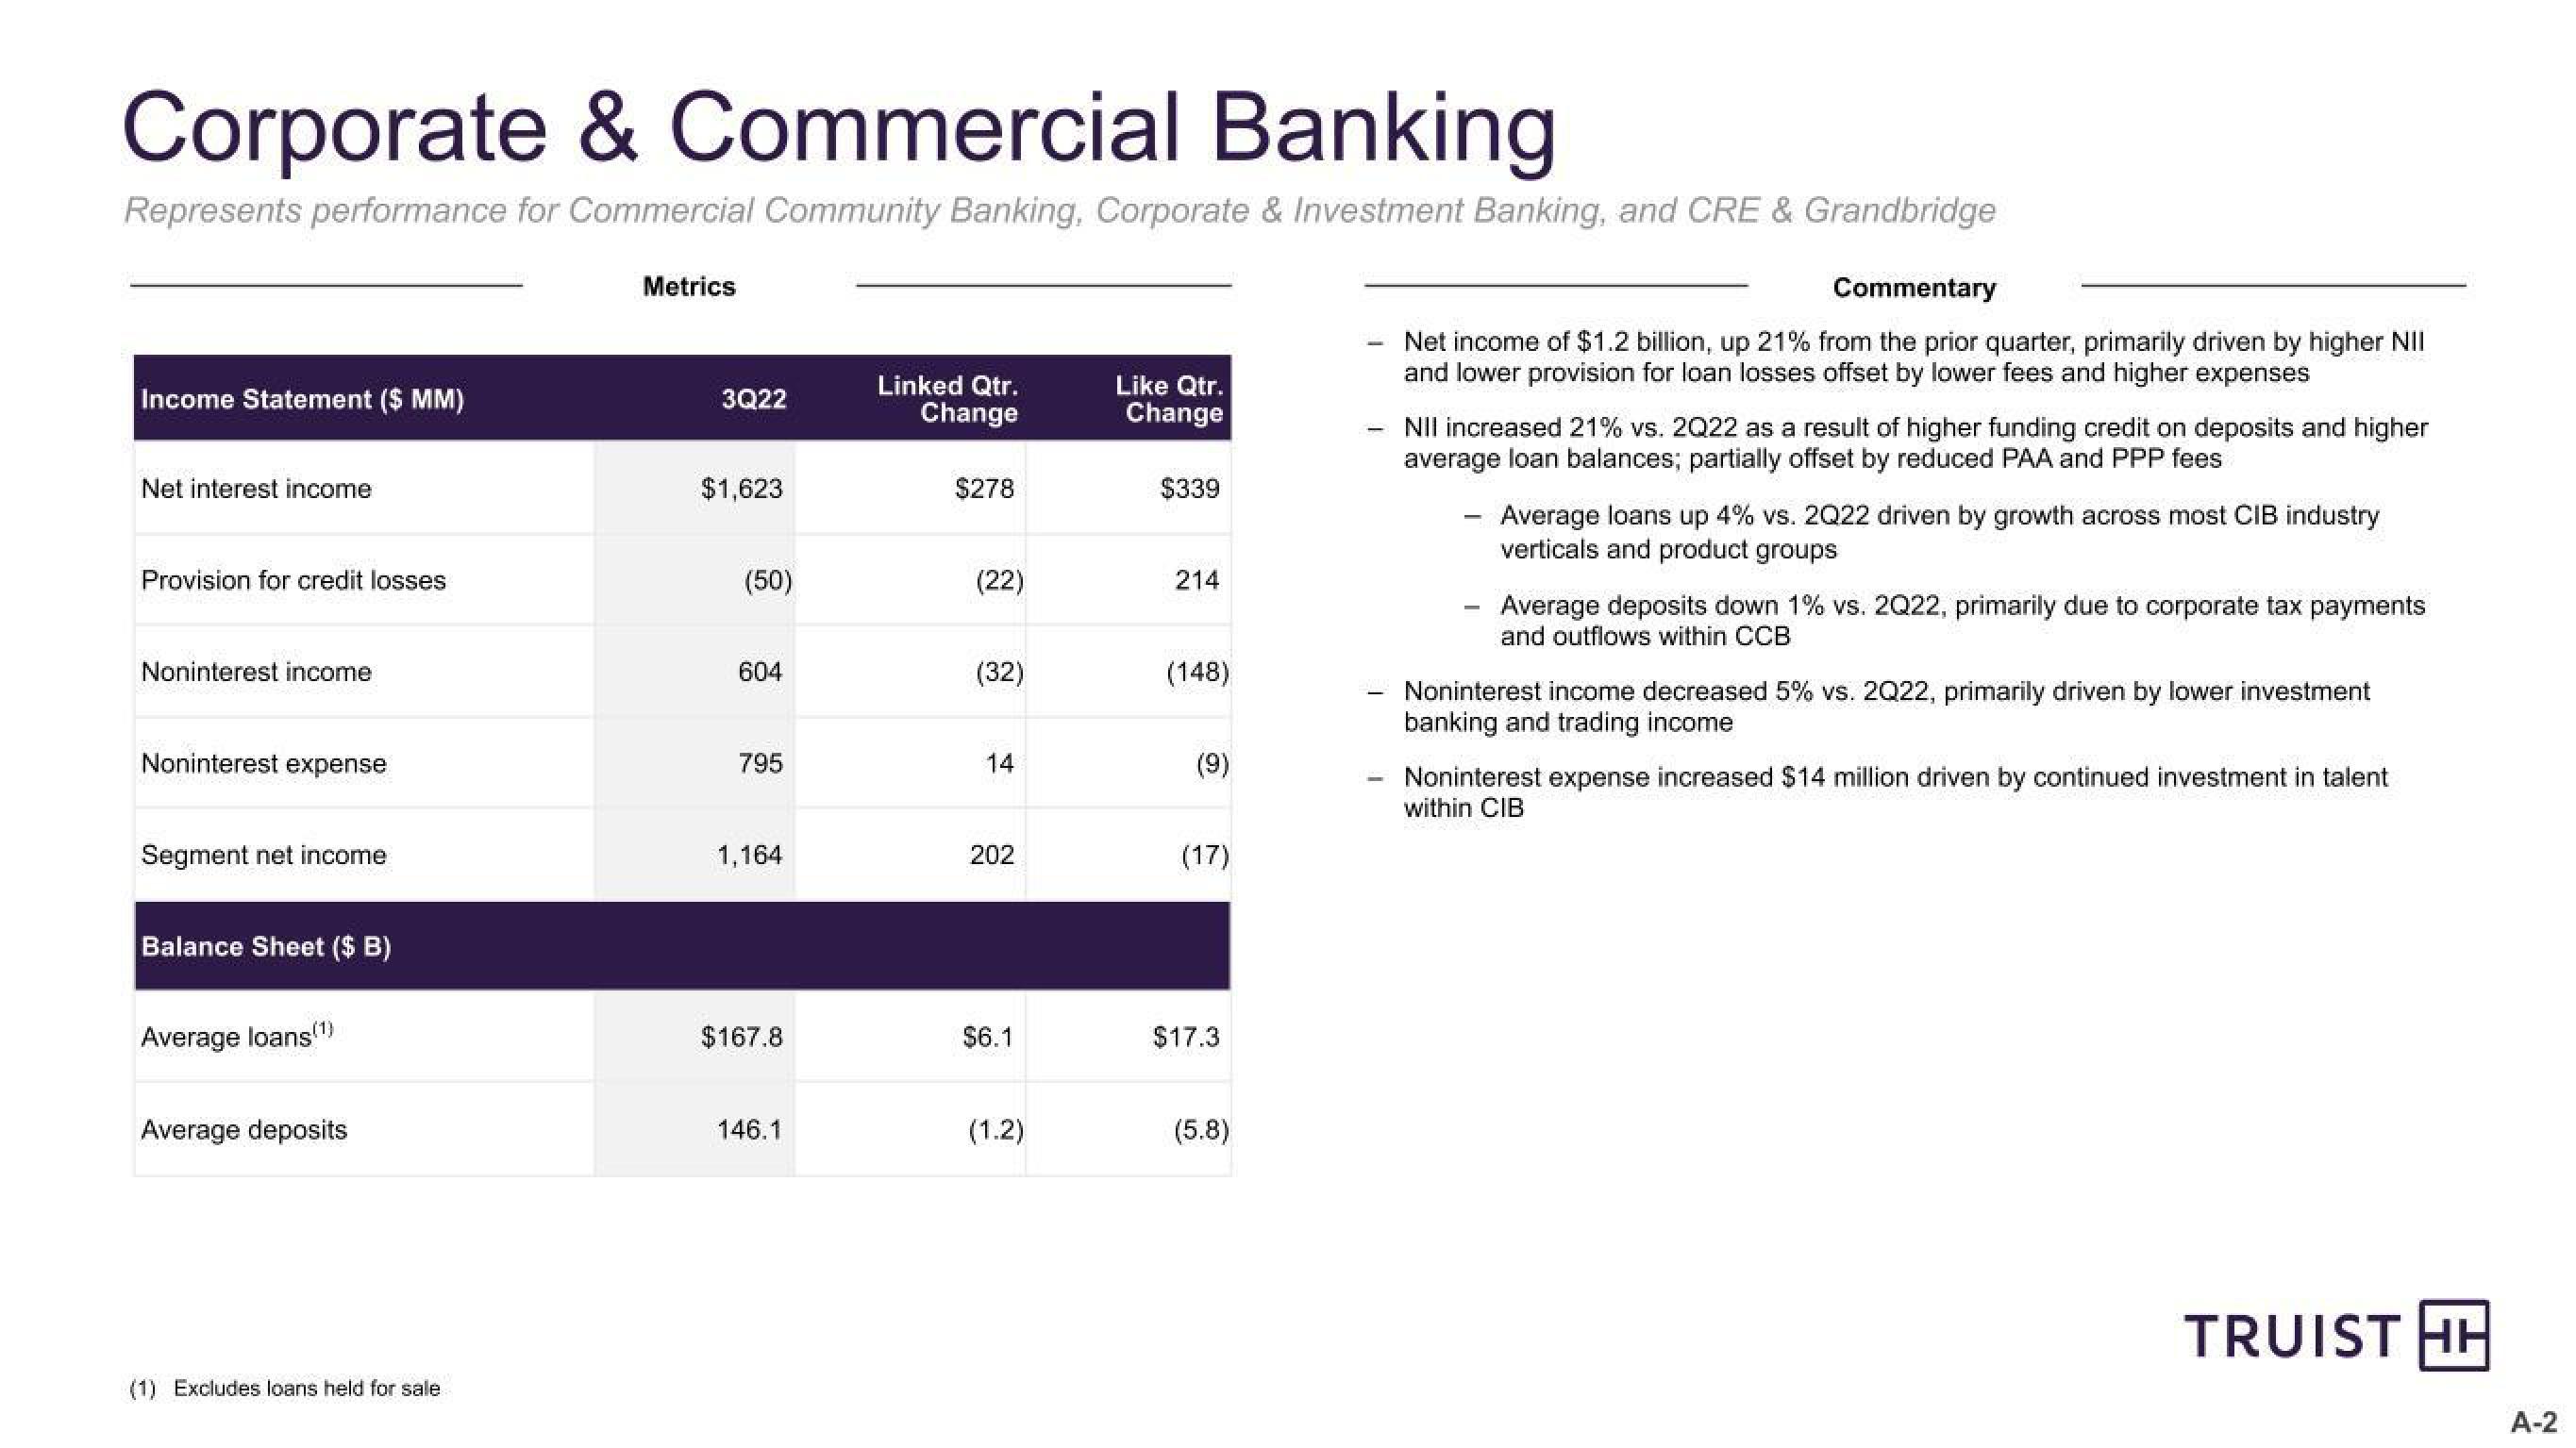
Income Statement ($ MM)
Net interest income
Provision for credit losses
Noninterest income
Noninterest expense
Segment net income
Balance Sheet ($ B)
Average loans(1)
Average deposits
(1) Excludes loans held for sale
Metrics
3Q22
$1,623
(50)
604
795
1,164
$167.8
146.1
Linked Qtr.
Change
$278
(22)
(32)
14
202
$6.1
(1.2)
Like Qtr.
Change
$339
214
(148)
(9)
(17)
$17.3
(5.8)
Commentary
Net income of $1.2 billion, up 21% from the prior quarter, primarily driven by higher NII
and lower provision for loan losses offset by lower fees and higher expenses
NII increased 21% vs. 2Q22 as a result of higher funding credit on deposits and higher
average loan balances; partially offset by reduced PAA and PPP fees
Average loans up 4% vs. 2Q22 driven by growth across most CIB industry
verticals and product groups
Average deposits down 1% vs. 2Q22, primarily due to corporate tax payments
and outflows within CCB
Noninterest income decreased 5% vs. 2Q22, primarily driven by lower investment
banking and trading income
Noninterest expense increased $14 million driven by continued investment in talent
within CIB
TRUIST HH
A-2View entire presentation