Yatsen IPO Presentation Deck
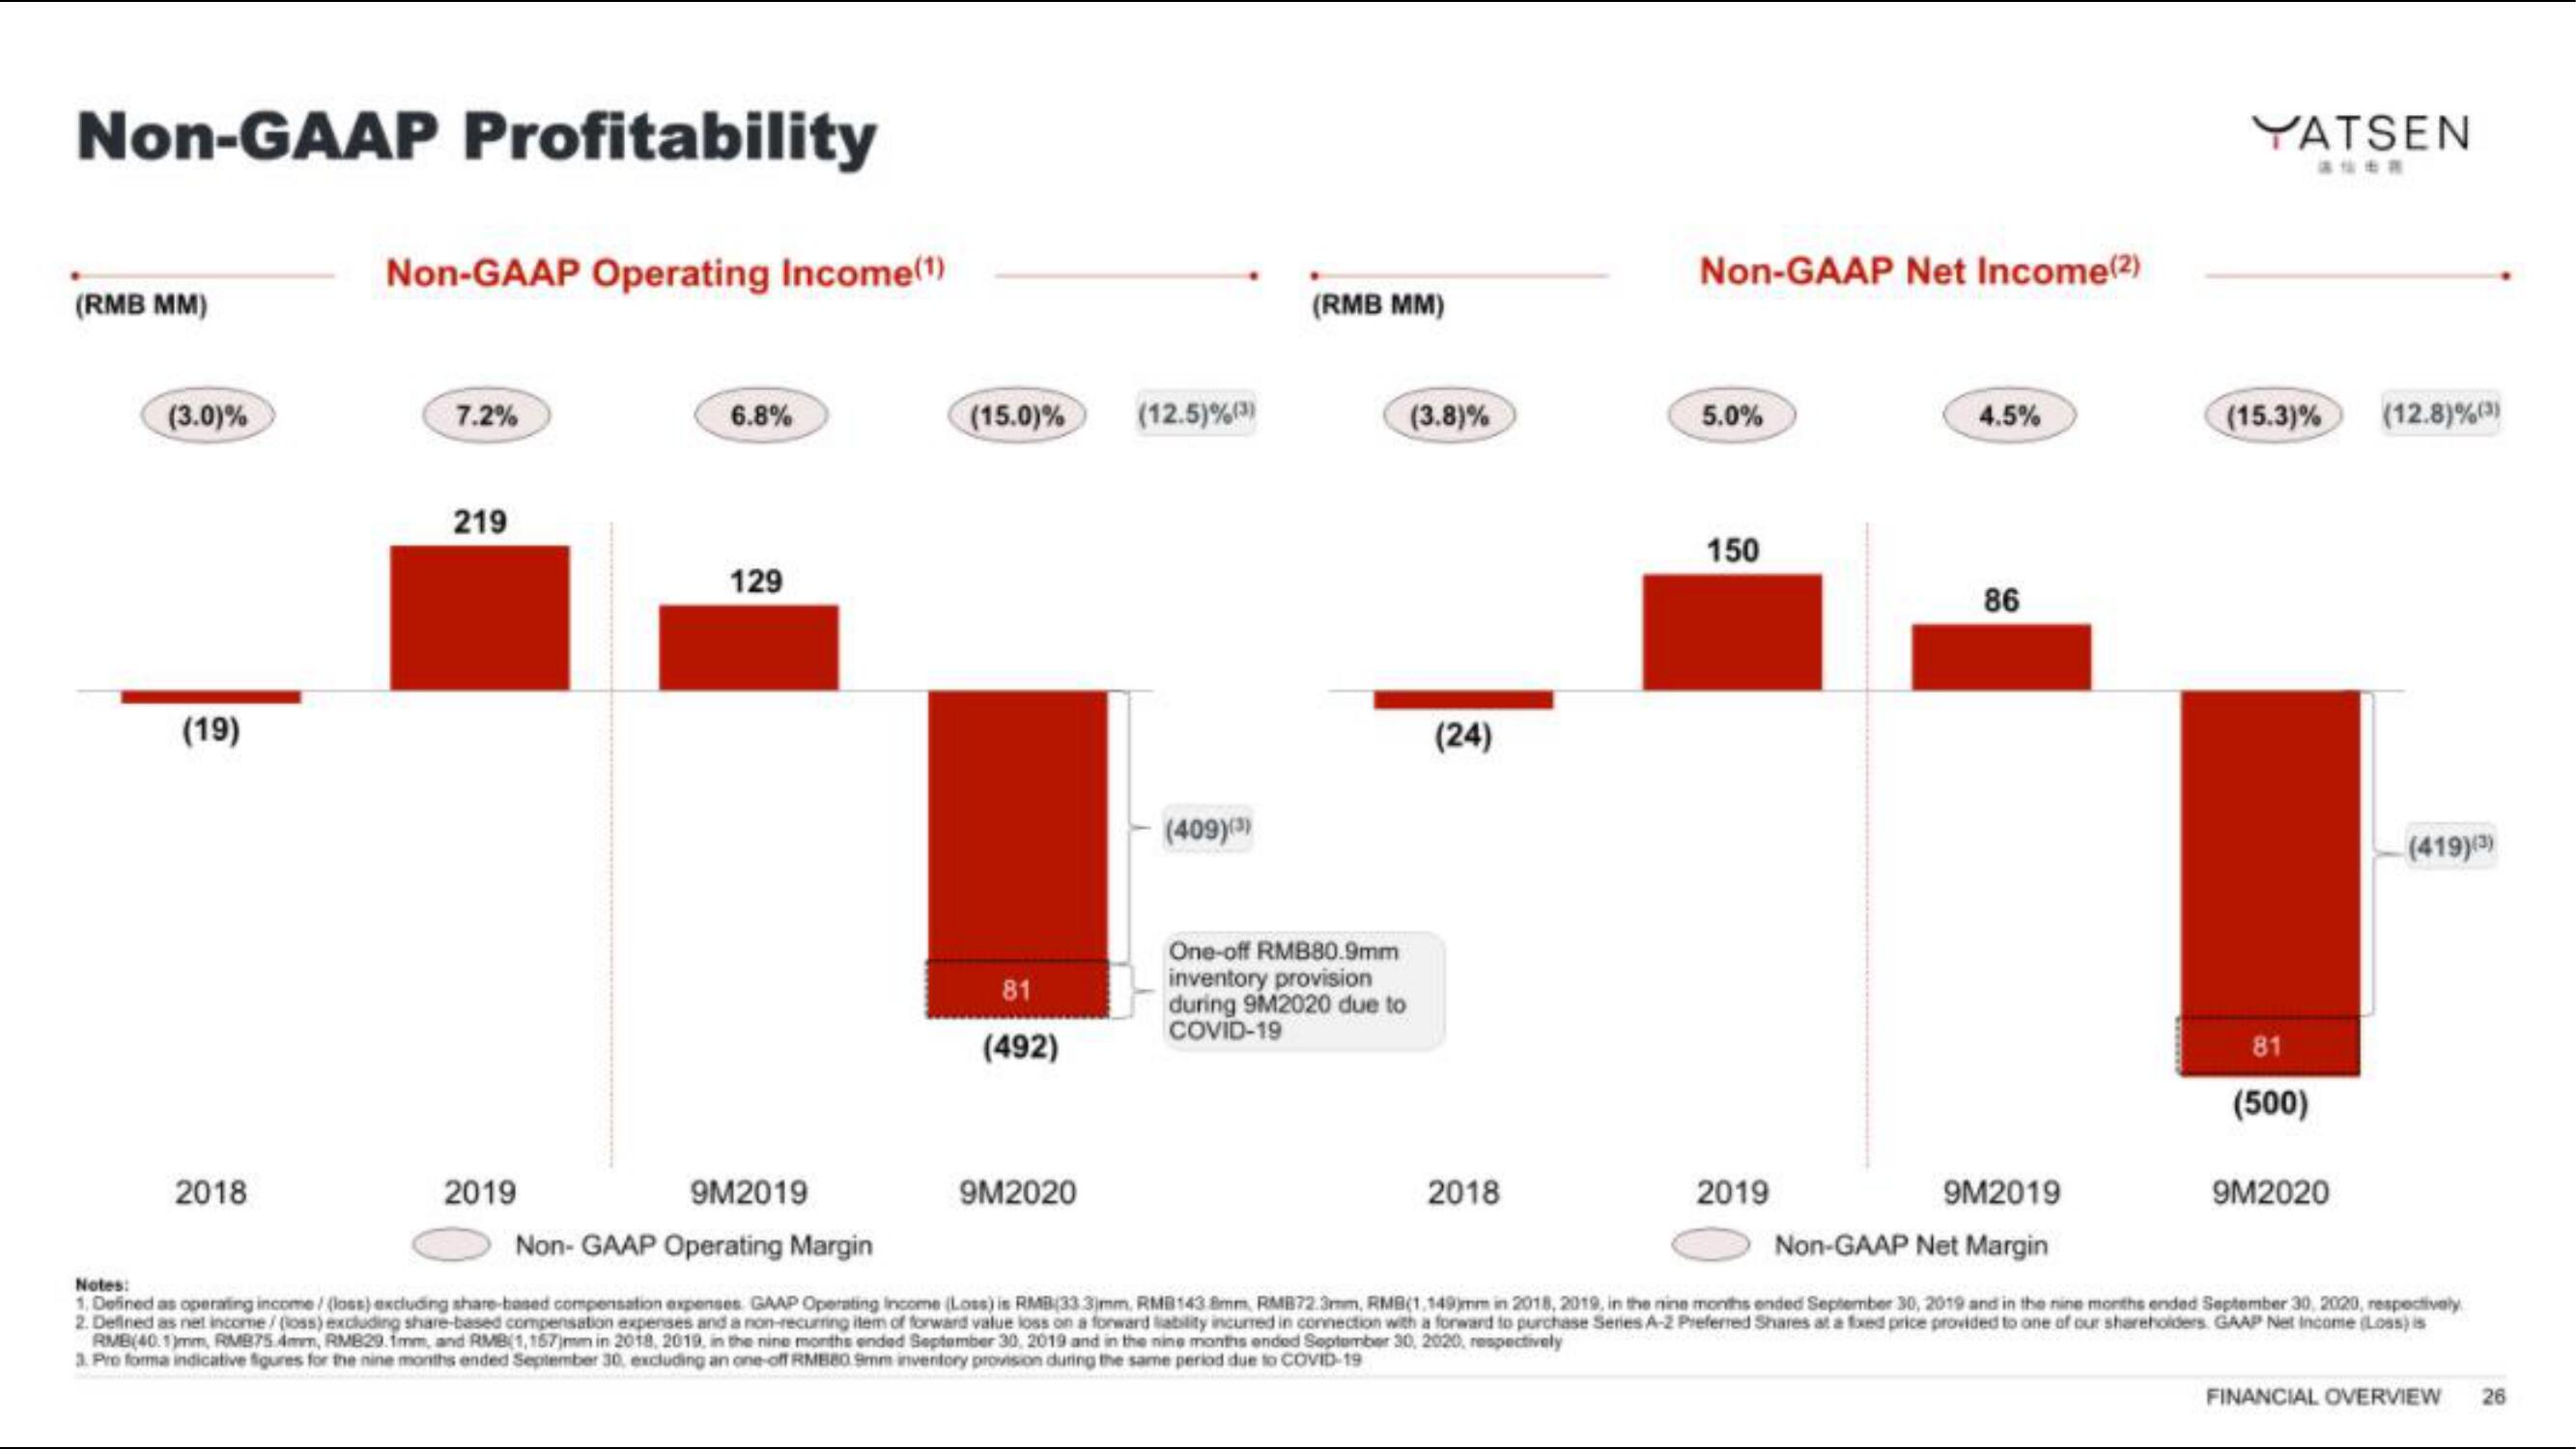
Non-GAAP Profitability
(RMB MM)
(3.0)%
(19)
Non-GAAP Operating Income(¹)
2018
7.2%
219
6.8%
2019
129
(15.0)% (12.5)%(3)
81
(492)
(409)(3)
9M2020
(RMB MM)
One-off RMB80.9mm
inventory provision
during 9M2020 due to
COVID-19
(3.8)%
(24)
Non-GAAP Net Income (2)
2018
5.0%
150
4.5%
2019
86
YATSEN
asen
9M2019
9M2019
Non- GAAP Operating Margin
Non-GAAP Net Margin
Notes:
1, Defined as operating income/(loss) excluding share-based compensation expenses. GAAP Operating Income (Loss) is RMB(33.3mm, RMB143 8mm RMB72.3mm, RMB(1,149)mm in 2018, 2019, in the nine months ended September 30, 2019 and in the nine months ended September 30, 2020, respectively
2. Defined as net income/(loss) excluding share-based compensation expenses and a non-recurring item of forward value loss on a forward liability incurred in connection with a forward to purchase Series A-2 Preferred Shares at a fixed price provided to one of our shareholders. GAAP Net Income (Loss) is
RMB(401)mm, RMB75 4mm, RMB29.1mm, and RMB(1,167)mm in 2018, 2019, in the nine months ended September 30, 2019 and in the nine months ended September 30, 2020, respectively
3. Pro forma indicative figures for the nine months ended September 30, excluding an one-off RMB80 9mm inventory provision during the same period due to COVID-19
(15.3)%
81
(500)
(12.8)%(3)
9M2020
(419)(3)
FINANCIAL OVERVIEW
26View entire presentation