Allego SPAC Presentation Deck
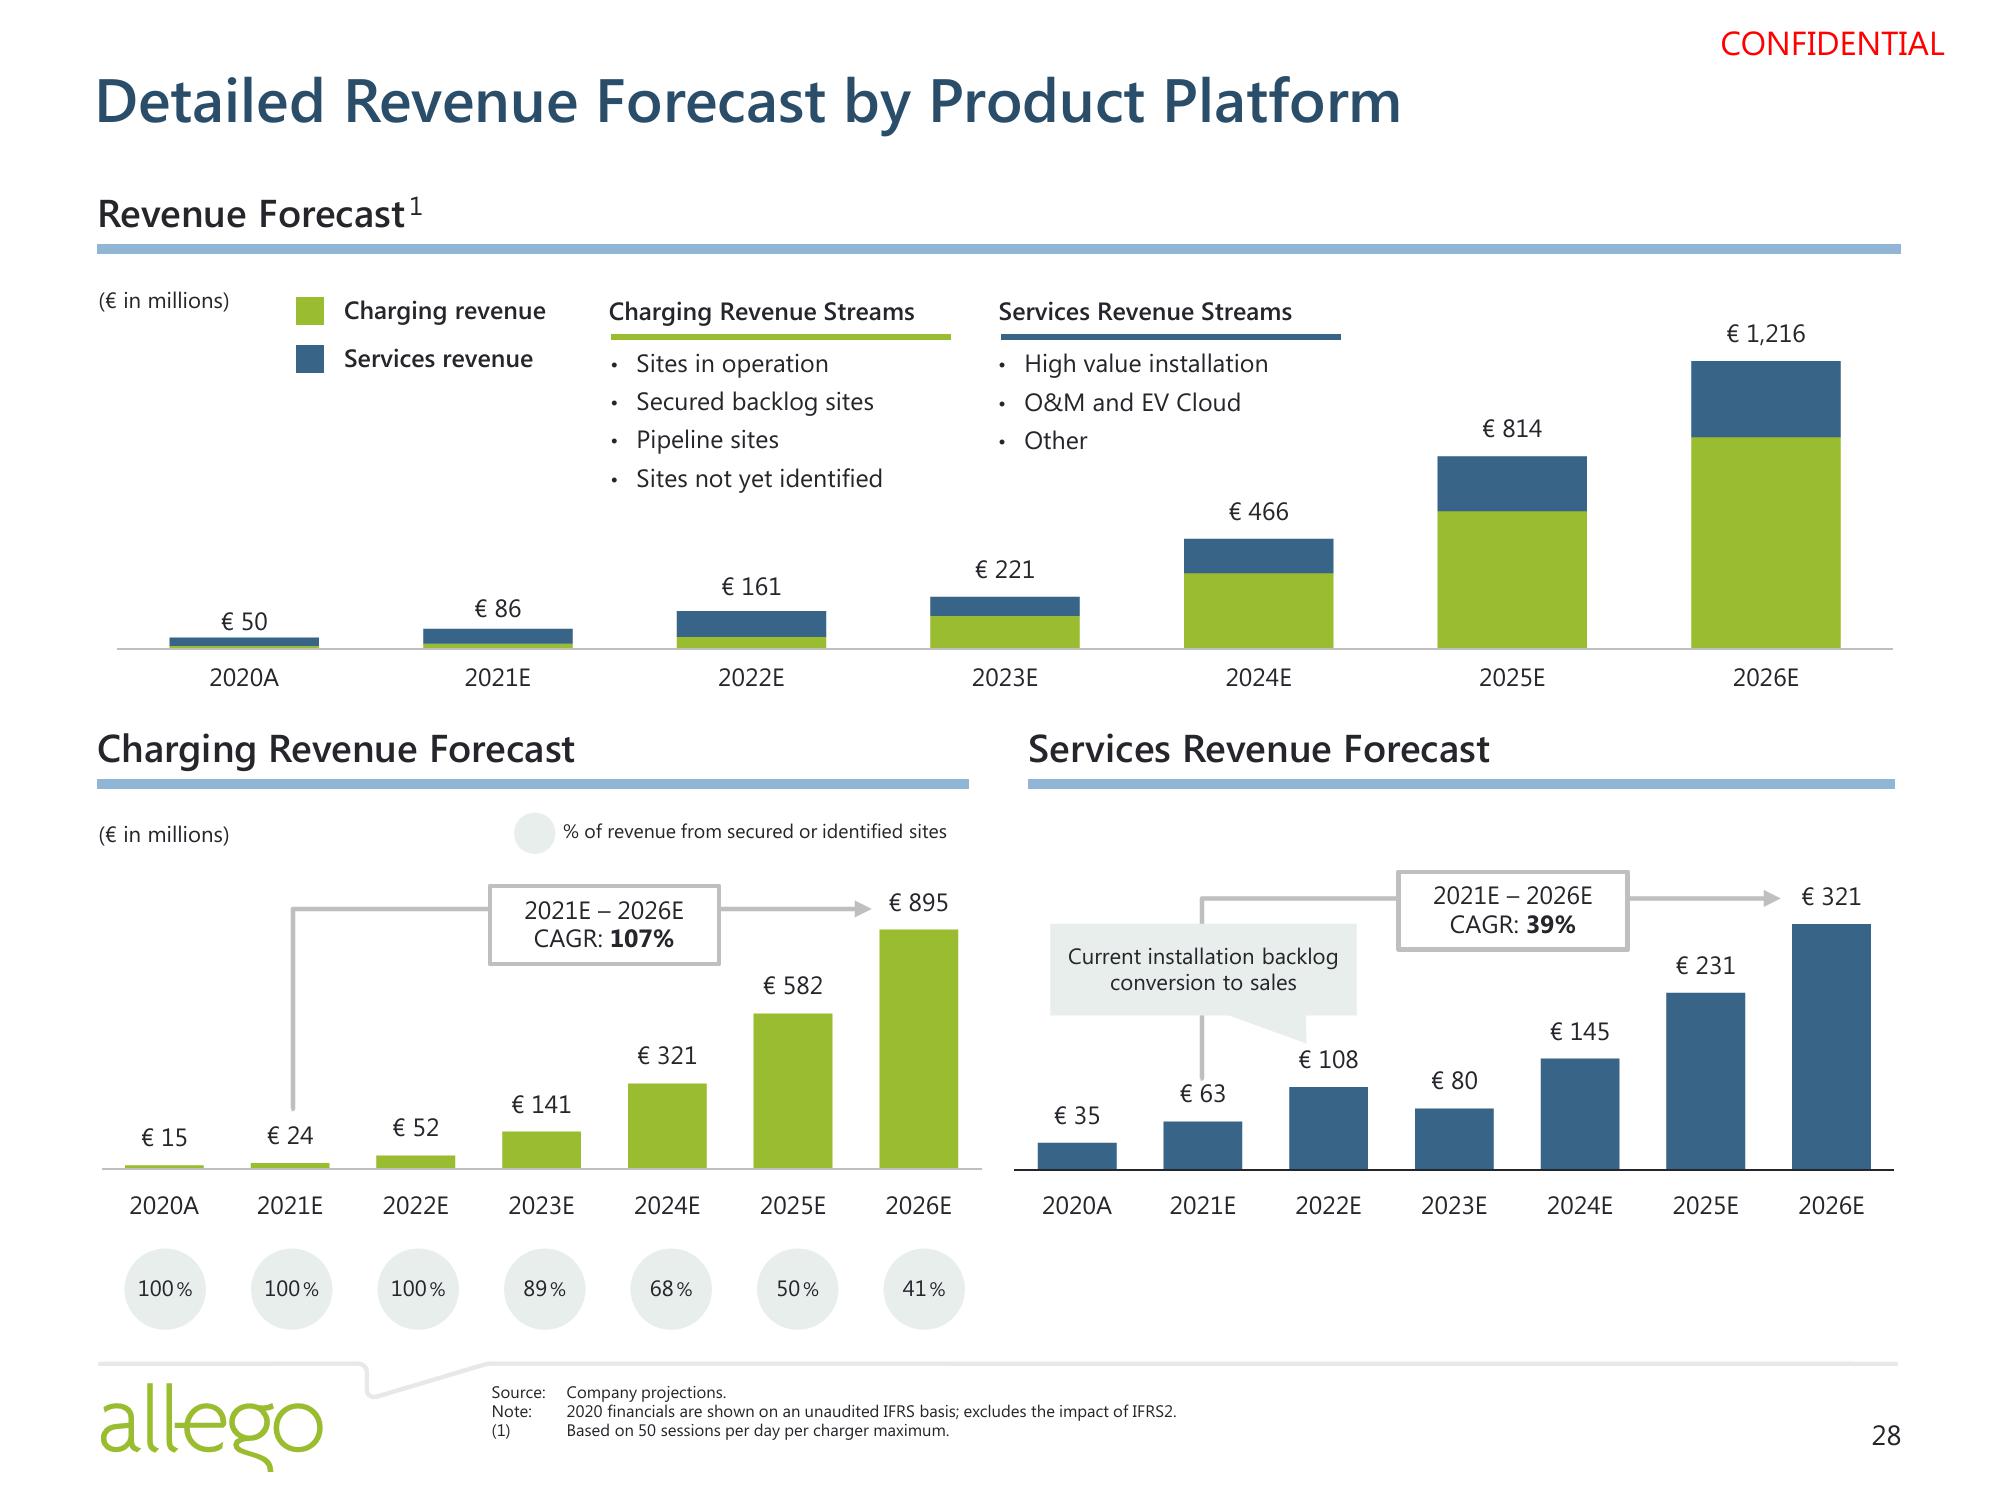
Detailed Revenue Forecast by Product Platform
Revenue Forecast ¹
(€ in millions)
€ 15
€ 50
(€ in millions)
2020A
2020A
100%
Charging Revenue Forecast
€ 24
2021E
100%
Charging revenue
Services revenue
allego
€ 52
2022E
€ 86
100%
2021E
€ 141
Charging Revenue Streams
Sites in operation
Secured backlog sites
Pipeline sites
Sites not yet identified
2023E
.
89%
●
2021E2026E
CAGR: 107%
●
% of revenue from secured or identified sites
€ 321
2024E
€ 161
68%
2022E
€ 582
2025E
50%
€ 895
2026E
41%
Services Revenue Streams
High value installation
O&M and EV Cloud
Other
.
.
.
€ 221
2023E
€ 35
Current installation backlog
conversion to sales
2020A
€ 466
2024E
Services Revenue Forecast
Source: Company projections.
Note: 2020 financials are shown on an unaudited IFRS basis; excludes the impact of IFRS2.
(1)
Based on 50 sessions per day per charger maximum.
€ 63
2021E
€ 108
2022E
€ 814
2025E
€ 80
2021E2026E
CAGR: 39%
2023E
€ 145
2024E
CONFIDENTIAL
€ 1,216
2026E
€ 231
2025E
€ 321
2026E
28View entire presentation