Inovalon Results Presentation Deck
Reconciliation of Net Income to Adjusted
EBITDA
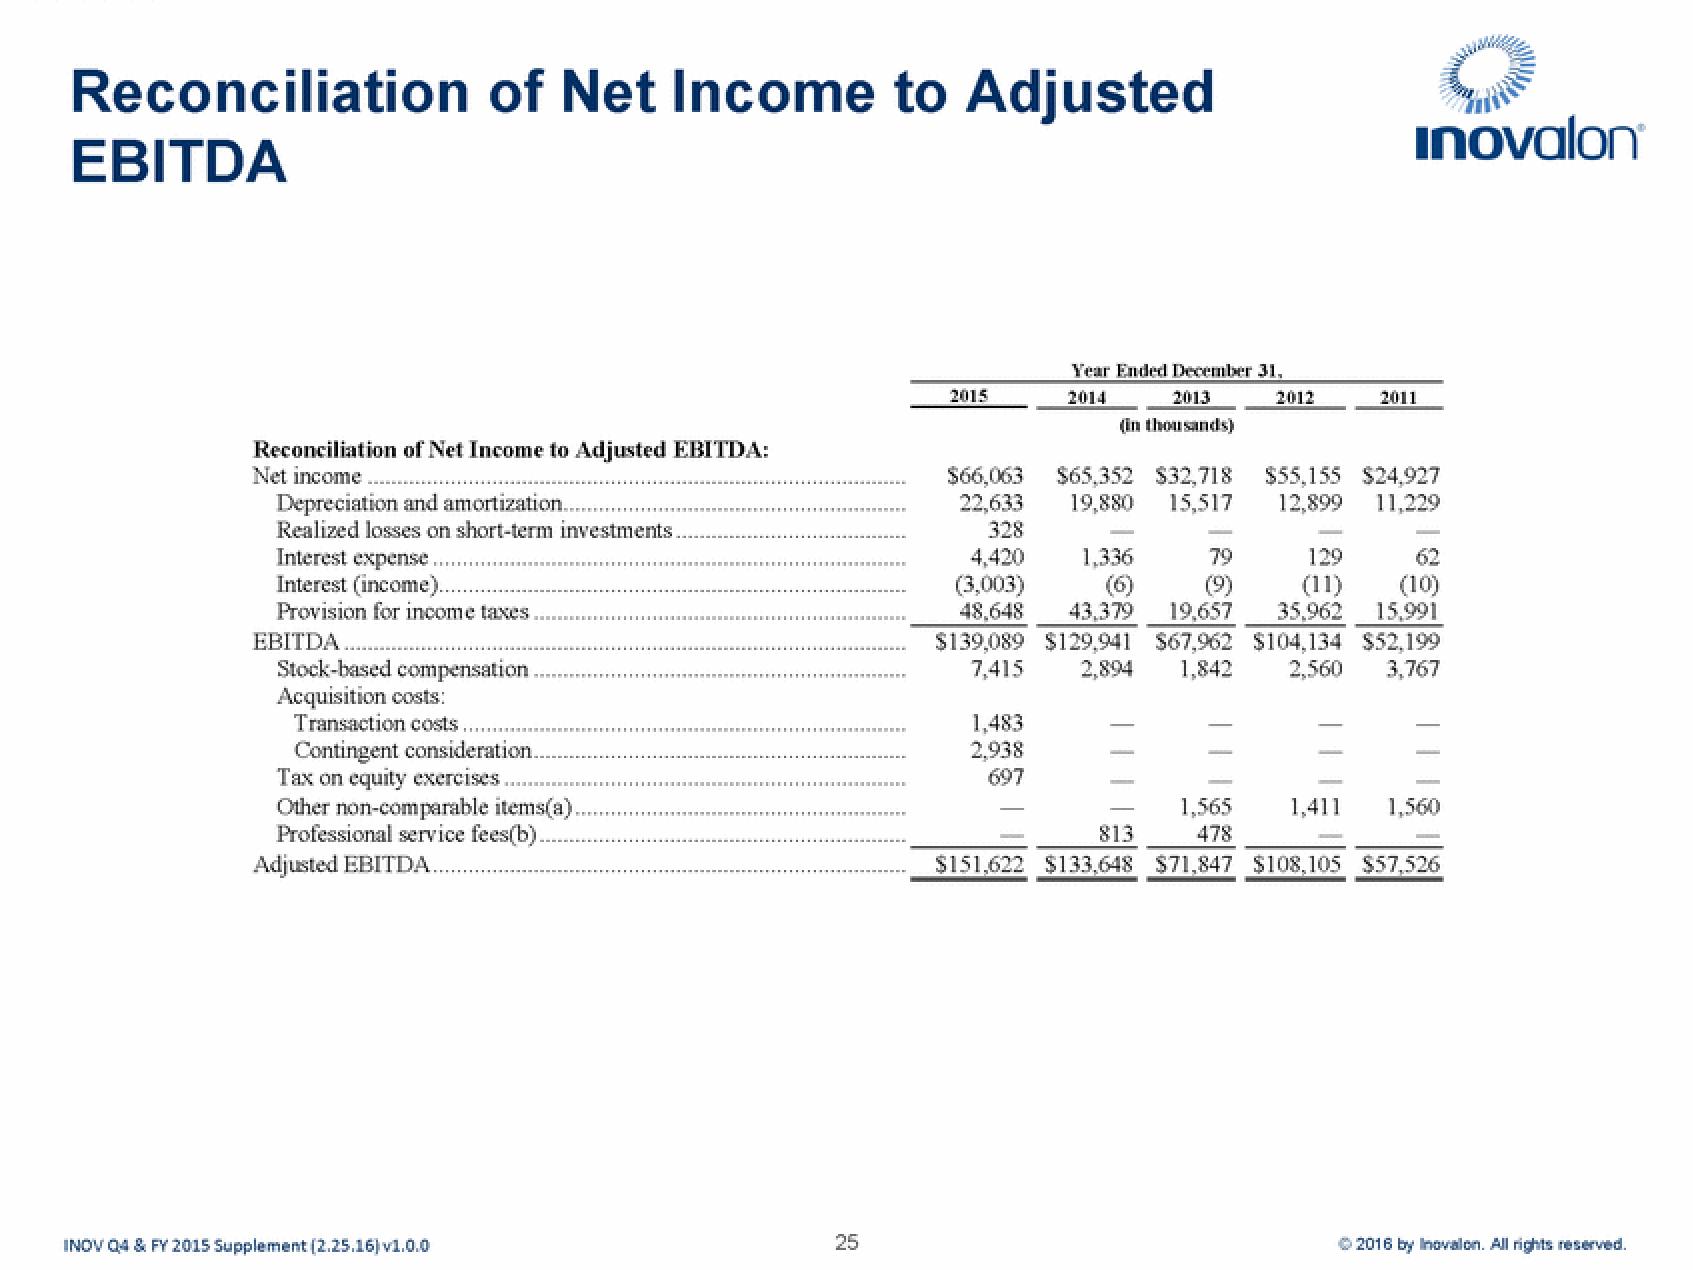
Reconciliation of Net Income to Adjusted EBITDA:
Net income
Depreciation and amortization..
Realized losses on short-term investments
Interest expense
Interest (income)..
Provision for income taxes.
EBITDA
Stock-based compensation.
Acquisition costs:
Transaction costs.
Contingent consideration..
Tax on equity exercises.
Other non-comparable items(a)
Professional service fees(b).
Adjusted EBITDA..
INOV Q4 & FY 2015 Supplement (2.25.16) v1.0.0
25
2015
Year Ended December 31,
2014
2013
(in thousands)
1,483
2,938
697
2012
1,336
inovalon
$65,352 $32,718 $55,155 $24,927
19,880 15,517 12,899
11,229
$66,063
22,633
328
4,420
(3,003)
79
(9)
(10)
48,648 43.379 19,657 35,962 15,991
$139,089 $129,941 $67,962 $104,134 $52,199
7,415 2,894 1,842 2,560 3,767
2011
129
1,411 1,560
1,565
478
813
$151,622 $133,648 $71,847 $108,105 $57,526
© 2016 by Inovalon. All rights reserved.View entire presentation