Investor Presentation
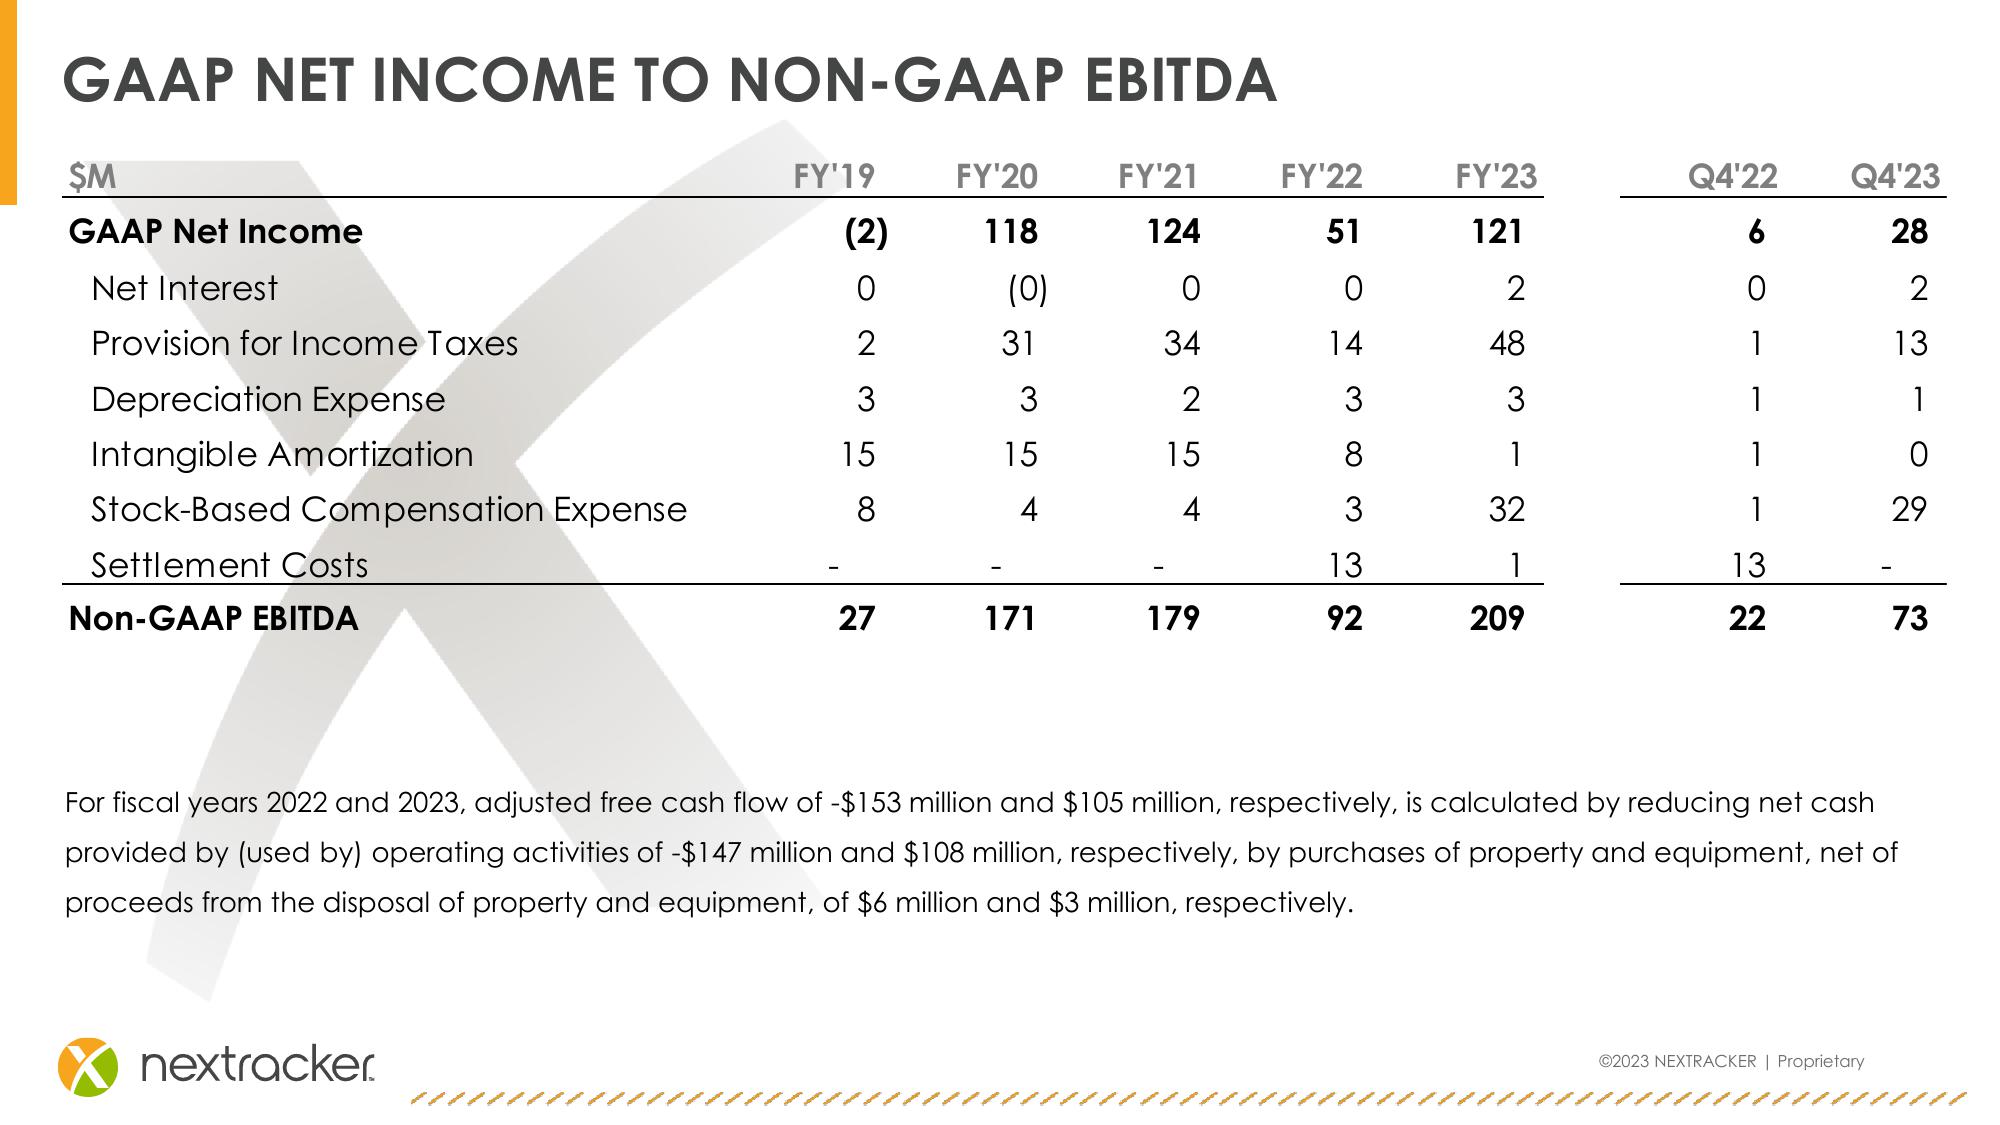
GAAP NET INCOME TO NON-GAAP EBITDA
$M
FY'19
FY'20
FY'21
FY'22
FY'23
Q4'22
Q4'23
GAAP Net Income
(2)
118
124
51
121
6
28
Net Interest
0
(0)
0
0
2
0
2
Provision for Income Taxes
2
31
34
14
48
1
13
Depreciation Expense
3
3
2
3
3
1
1
Intangible Amortization
15
15
15
8
1
1
0
Stock-Based Compensation Expense
8
4
3
32
1
29
Settlement Costs
13
1
13
Non-GAAP EBITDA
27
171
179
92
209
22
73
For fiscal years 2022 and 2023, adjusted free cash flow of -$153 million and $105 million, respectively, is calculated by reducing net cash
provided by (used by) operating activities of -$147 million and $108 million, respectively, by purchases of property and equipment, net of
proceeds from the disposal of property and equipment, of $6 million and $3 million, respectively.
nextracker.
©2023 NEXTRACKER | ProprietaryView entire presentation