Lyft Results Presentation Deck
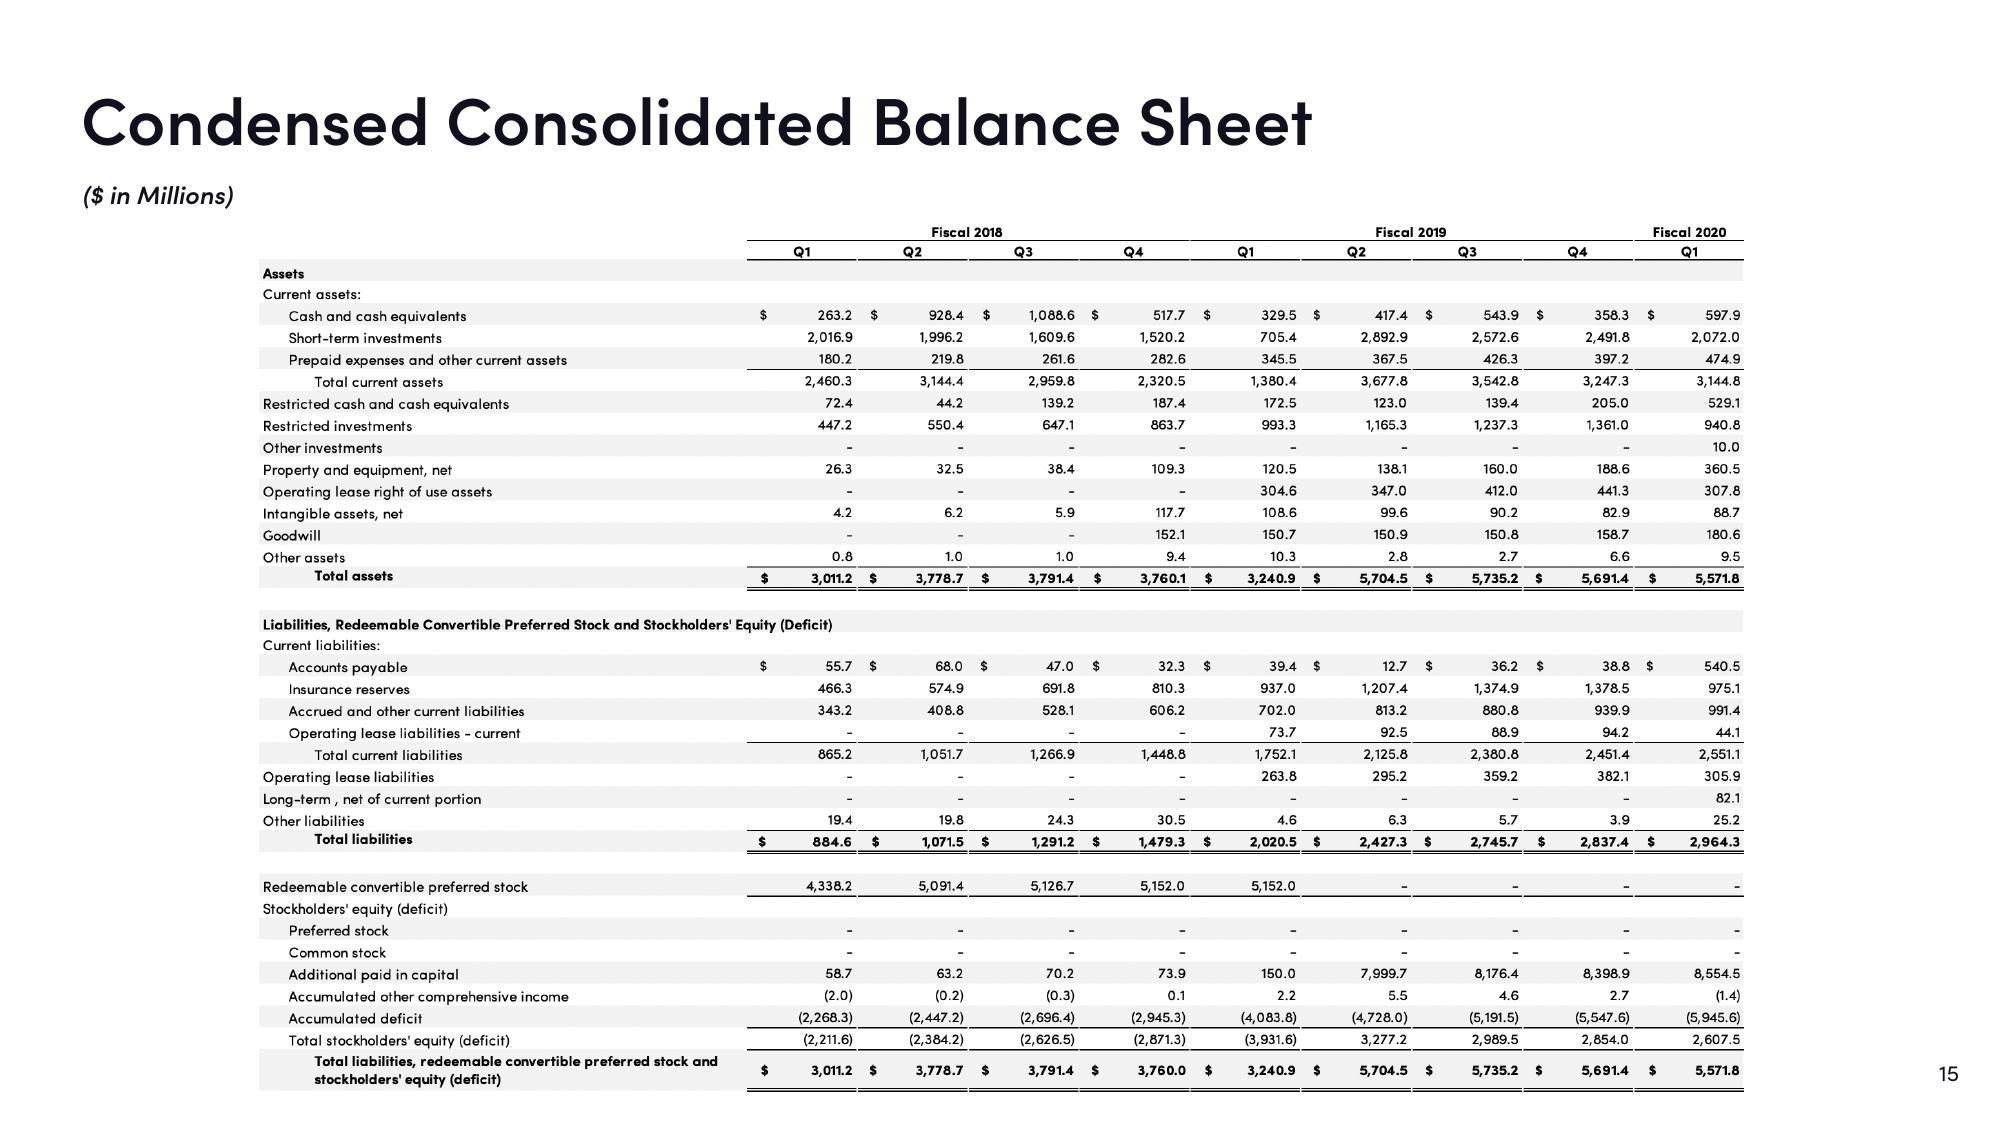
Condensed Consolidated Balance Sheet
($ in Millions)
Assets
Current assets:
Cash and cash equivalents
Short-term investments
Prepaid expenses and other current assets
Total current assets
Restricted cash and cash equivalents
Restricted investments
Other investments
Property and equipment, net
Operating lease right of use assets
Intangible assets, net
Goodwill
Other assets
Total assets
Accounts payable
Insurance reserves
Accrued and other current liabilities
Operating lease liabilities - current
Total current liabilities
Operating lease liabilities
Long-term, net of current portion
Other liabilities
Total liabilities
Redeemable convertible preferred stock
Stockholders' equity (deficit)
Preferred stock
Common stock
Additional paid in capital
Accumulated other comprehensive income
Accumulated deficit
$
Liabilities, Redeemable Convertible Preferred Stock and Stockholders' Equity (Deficit)
Current liabilities:
Total stockholders' equity (deficit)
Total liabilities, redeemable convertible preferred stock and
stockholders' equity (deficit)
$
$
$
Q1
$
263.2 $
2,016.9
180.2
2,460.3
72.4
447.2
26.3
4.2
0.8
3,011.2 $
55.7 $
466.3
343.2
865.2
19.4
884.6 $
4,338.2
58.7
(2.0)
(2,268.3)
(2,211.6)
3,011.2
$
Q2
Fiscal 2018
928.4 $
1,996.2
219.8
3,144.4
44.2
550.4
32.5
6.2
1.0
3,778.7 $
68.0 $
574.9
408.8
1,051.7
19.8
1,071.5 $
5,091.4
63.2
(0.2)
(2,447.2)
(2,384.2)
3,778.7 $
Q3
1,088.6
1,609.6
261.6
2,959.8
139.2
647.1
38.4
5.9
1.0
3,791.4
47.0
691.8
528.1
1,266.9
5,126.7
$
70.2
(0.3)
(2,696.4)
(2,626.5)
$
24.3
1,291.2 $
$
3,791.4 $
Q4
517.7 $
1,520.2
282.6
2,320.5
187.4
863.7
109.3
117.7
152.1
9.4
3,760.1 $
32.3 $
810.3
606.2
1,448.8
30.5
1,479.3
5,152.0
73.9
0.1
$
(2,945.3)
(2,871.3)
3,760.0 $
Q1
329.5 $
705.4
345.5
1,380.4
172.5
993.3
120.5
304.6
108.6
150.7
10.3
3,240.9
39.4 $
937.0
702.0
73.7
1,752.1
263.8
4.6
2,020.5 $
5,152.0
$
150.0
(4,083.8)
(3,931.6)
3,240.9
$
Q2
Fiscal 2019
417.4 $
2,892.9
367.5
3,677.8
123.0
1,165.3
138.1
347.0
99.6
150.9
2.8
5,704.5
12.7
1,207.4
813.2
92.5
2,125.8
295.2
$
7,999.7
5.5
(4,728.0)
3,277.2
$
6.3
2,427.3 $
5,704.5 $
Q3
543.9 $
2,572.6
426.3
3,542.8
139.4
1,237.3
160.0
412.0
90.2
150.8
2.7
5,735.2
36.2
1,374.9
880.8
88.9
2,380.8
359.2
5.7
2,745.7
$
$
$
8,176.4
4.6
(5,191.5)
2,989.5
5,735.2 $
Q4
358.3 $
2,491.8
397.2
3,247.3
205.0
1,361.0
188.6
441.3
82.9
158.7
6.6
5,691.4
38.8
1,378.5
939.9
94.2
2,451.4
382.1
3.9
2,837.4
Fiscal 2020
Q1
8,398.9
2.7
(5,547.6)
2,854.0
5,691.4
$
$
$
$
597.9
2,072.0
474.9
3,144.8
529.1
940.8
10.0
360.5
307.8
88.7
180.6
9.5
5,571.8
540.5
975.1
991.4
44.1
2,551.1
305.9
82.1
25.2
2,964.3
8,554.5
(1.4)
(5,945.6)
2,607.5
5,571.8
15View entire presentation