OmniAb Investor Presentation Deck
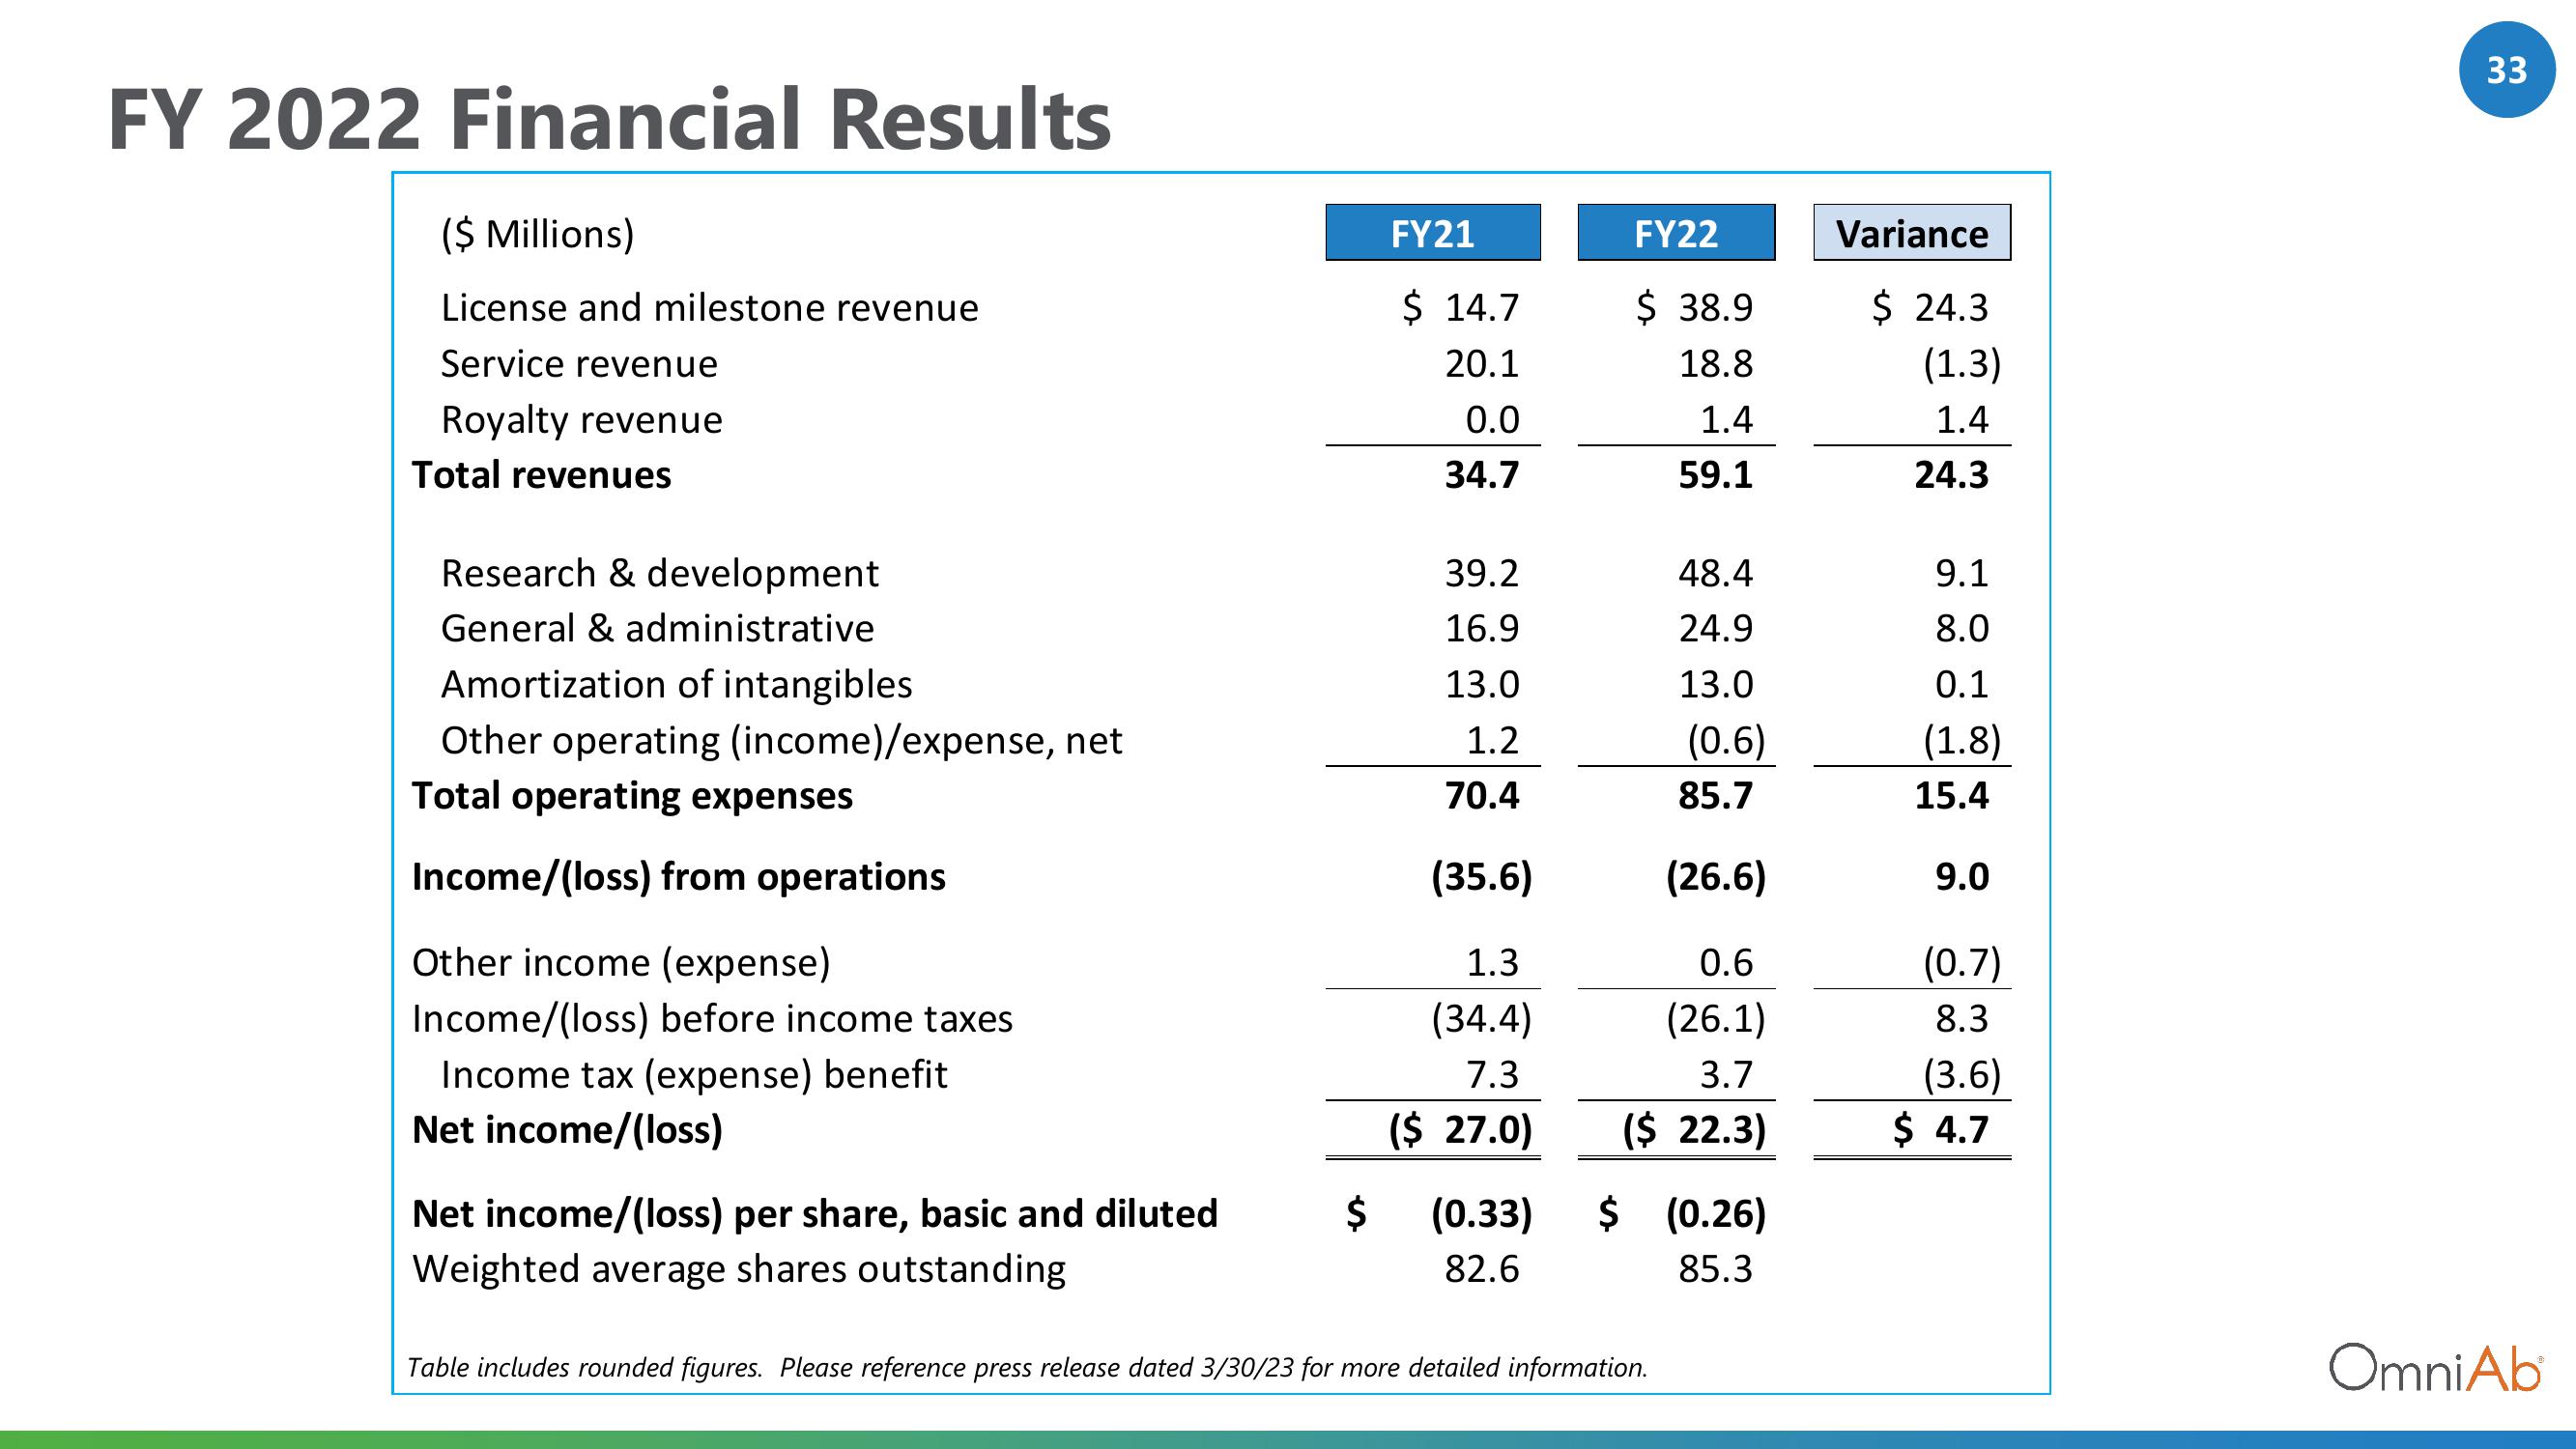
FY 2022 Financial Results
($ Millions)
License and milestone revenue
Service revenue
Royalty revenue
Total revenues
Research & development
General & administrative
Amortization of intangibles
Other operating (income)/expense, net
Total operating expenses
Income/(loss) from operations
Other income (expense)
Income/(loss) before income taxes
Income tax (expense) benefit
Net income/(loss)
Net income/(loss) per share, basic and diluted
Weighted average shares outstanding
$
FY21
Ś 14.7
20.1
0.0
34.7
39.2
16.9
13.0
1.2
70.4
(35.6)
1.3
(34.4)
7.3
($ 27.0)
(0.33)
82.6
FY22
$38.9
18.8
1.4
59.1
48.4
24.9
13.0
(0.6)
85.7
(26.6)
0.6
(26.1)
3.7
($ 22.3)
$ (0.26)
85.3
Table includes rounded figures. Please reference press release dated 3/30/23 for more detailed information.
Variance
$ 24.3
(1.3)
1.4
24.3
9.1
8.0
0.1
(1.8)
15.4
9.0
(0.7)
8.3
(3.6)
$ 4.7
33
OmniAbView entire presentation