Informatica Investor Presentation Deck
49
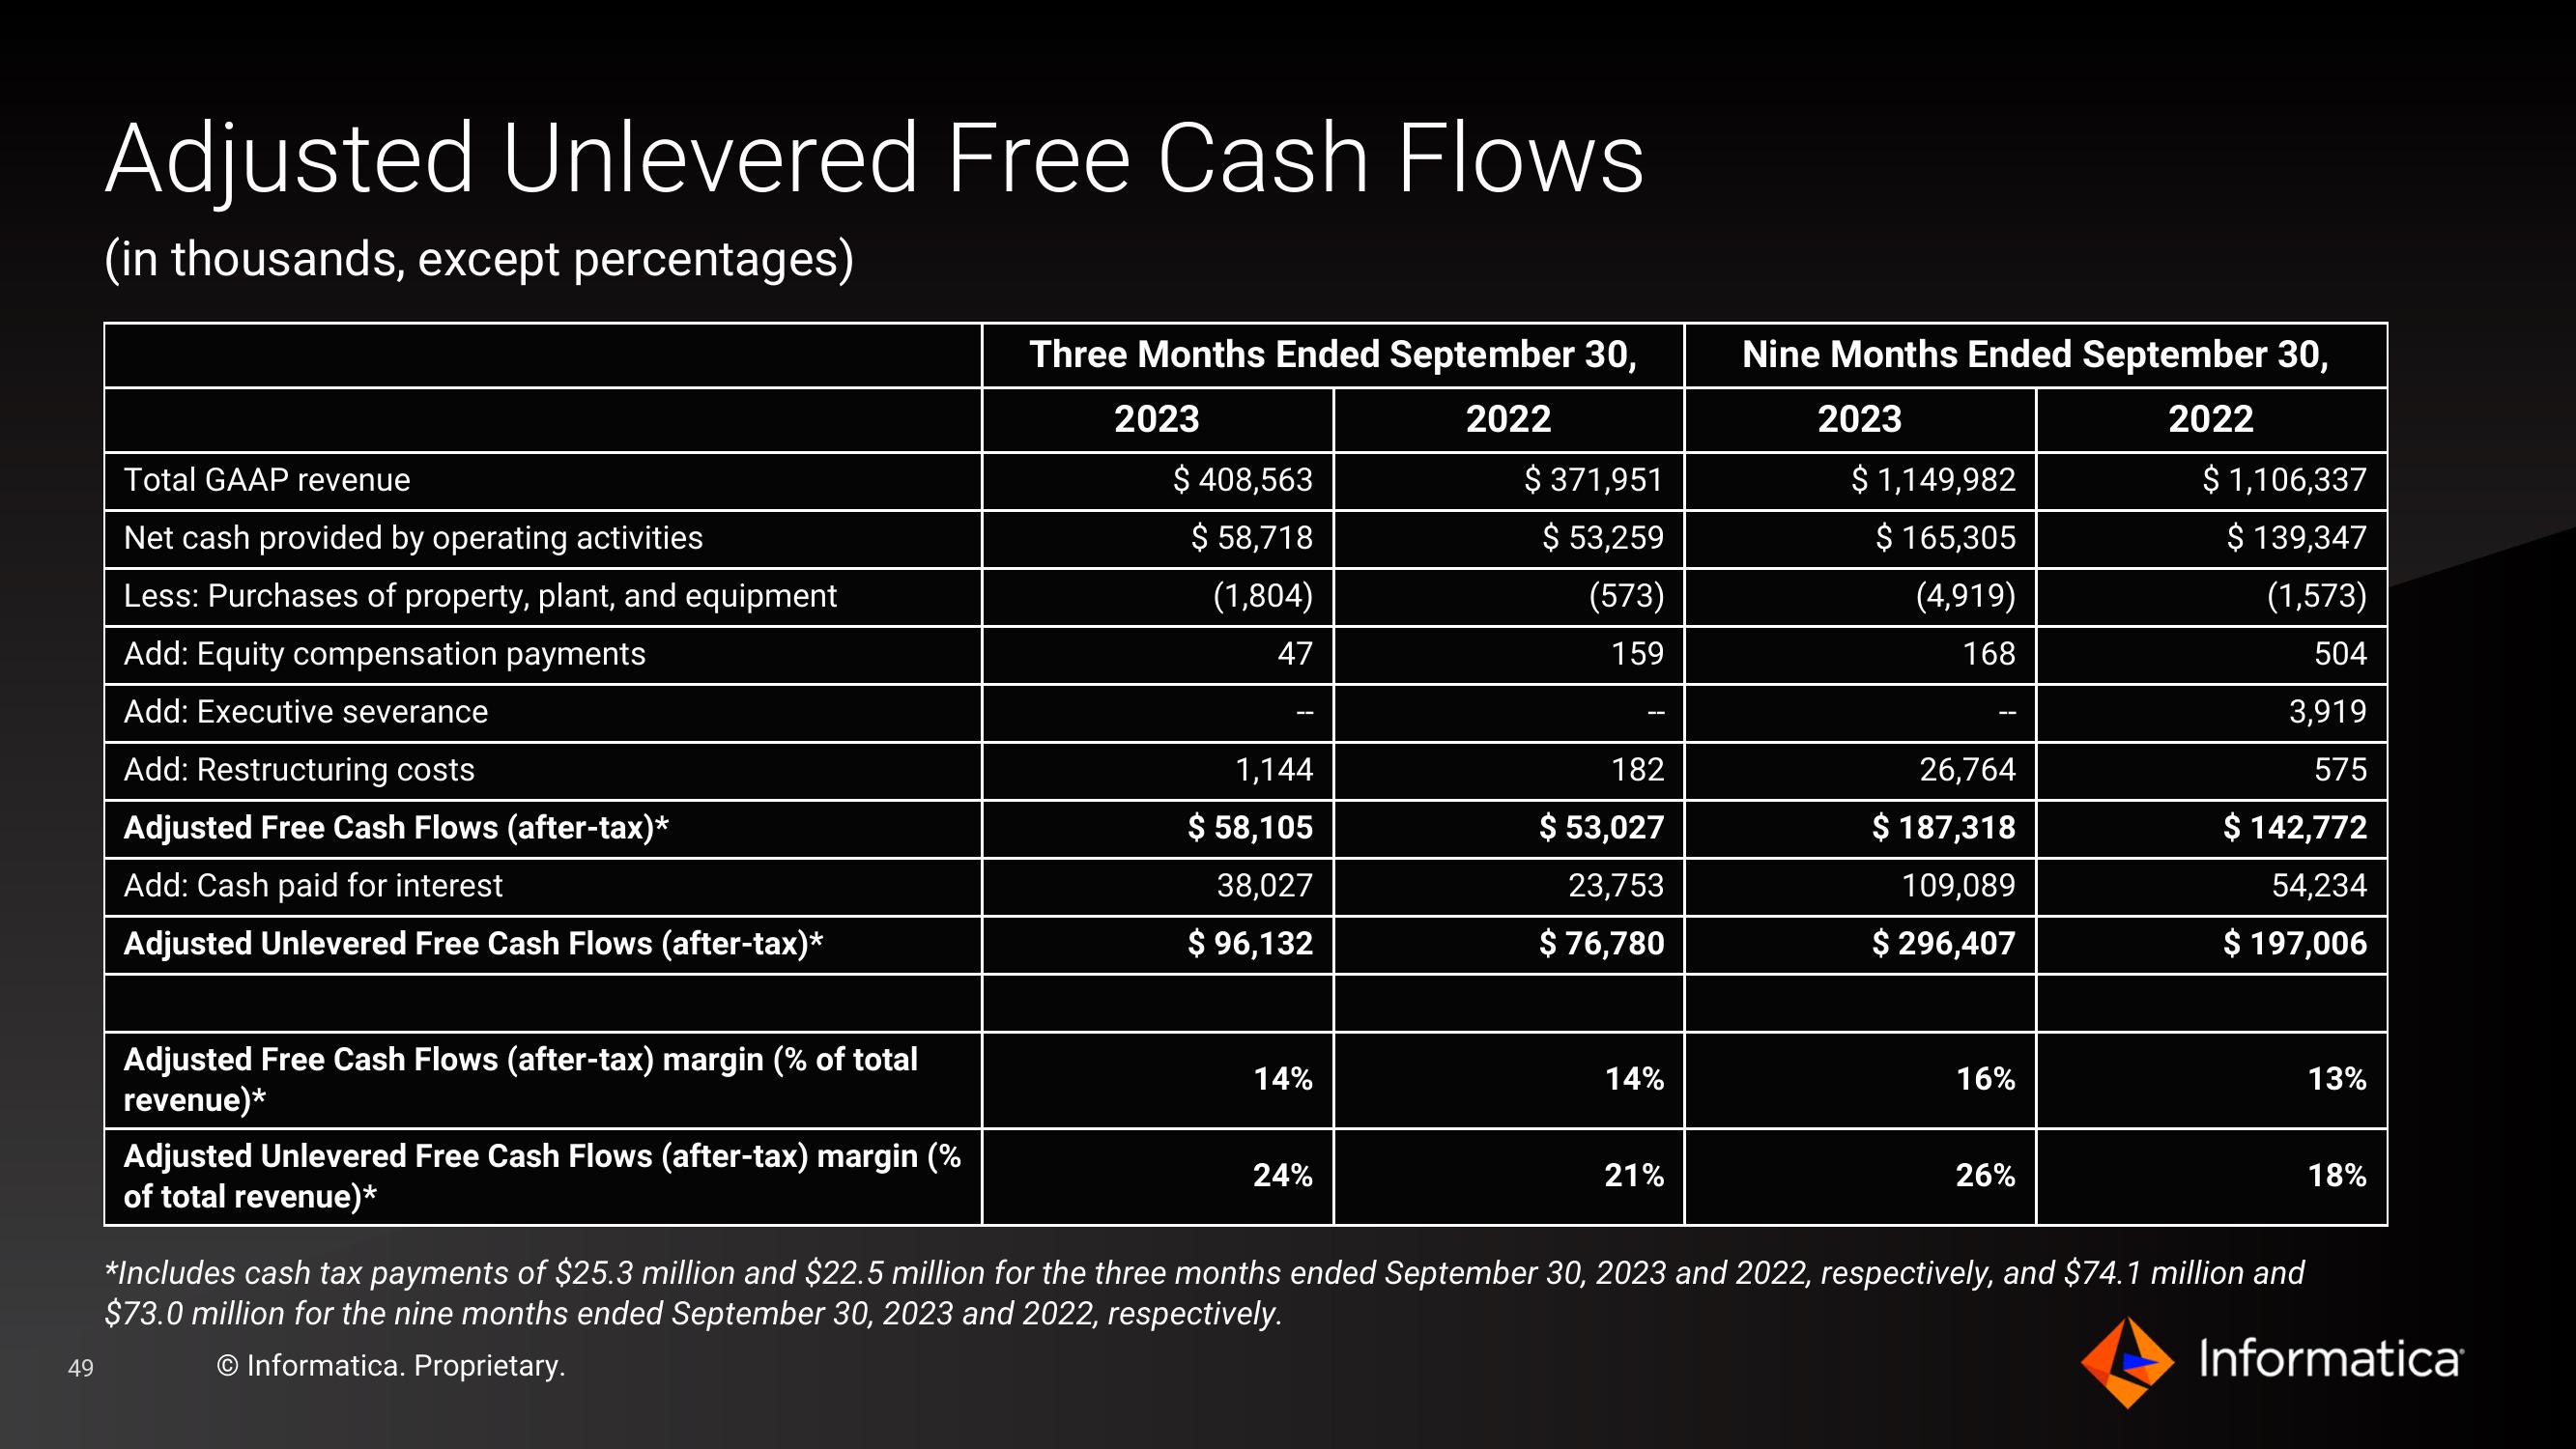
Adjusted Unlevered Free Cash Flows
(in thousands, except percentages)
Total GAAP revenue
Net cash provided by operating activities
Less: Purchases of property, plant, and equipment
Add: Equity compensation payments
Add: Executive severance
Add: Restructuring costs
Adjusted Free Cash Flows (after-tax)*
Add: Cash paid for interest
Adjusted Unlevered Free Cash Flows (after-tax)*
Adjusted Free Cash Flows (after-tax) margin (% of total
revenue)*
Adjusted Unlevered Free Cash Flows (after-tax) margin (%
of total revenue)*
Three Months Ended September 30,
2023
2022
$ 408,563
$ 58,718
(1,804)
47
1,144
$ 58,105
38,027
$ 96,132
14%
24%
$ 371,951
$ 53,259
(573)
159
182
$ 53,027
23,753
$ 76,780
14%
21%
Nine Months Ended September 30,
2023
2022
$ 1,149,982
$ 165,305
(4,919)
168
26,764
$ 187,318
109,089
$ 296,407
16%
26%
$ 1,106,337
$ 139,347
(1,573)
504
3,919
575
$ 142,772
54,234
$ 197,006
13%
18%
*Includes cash tax payments of $25.3 million and $22.5 million for the three months ended September 30, 2023 and 2022, respectively, and $74.1 million and
$73.0 million for the nine months ended September 30, 2023 and 2022, respectively.
Informatica
O Informatica. Proprietary.View entire presentation