DraftKings Investor Day Presentation Deck
●
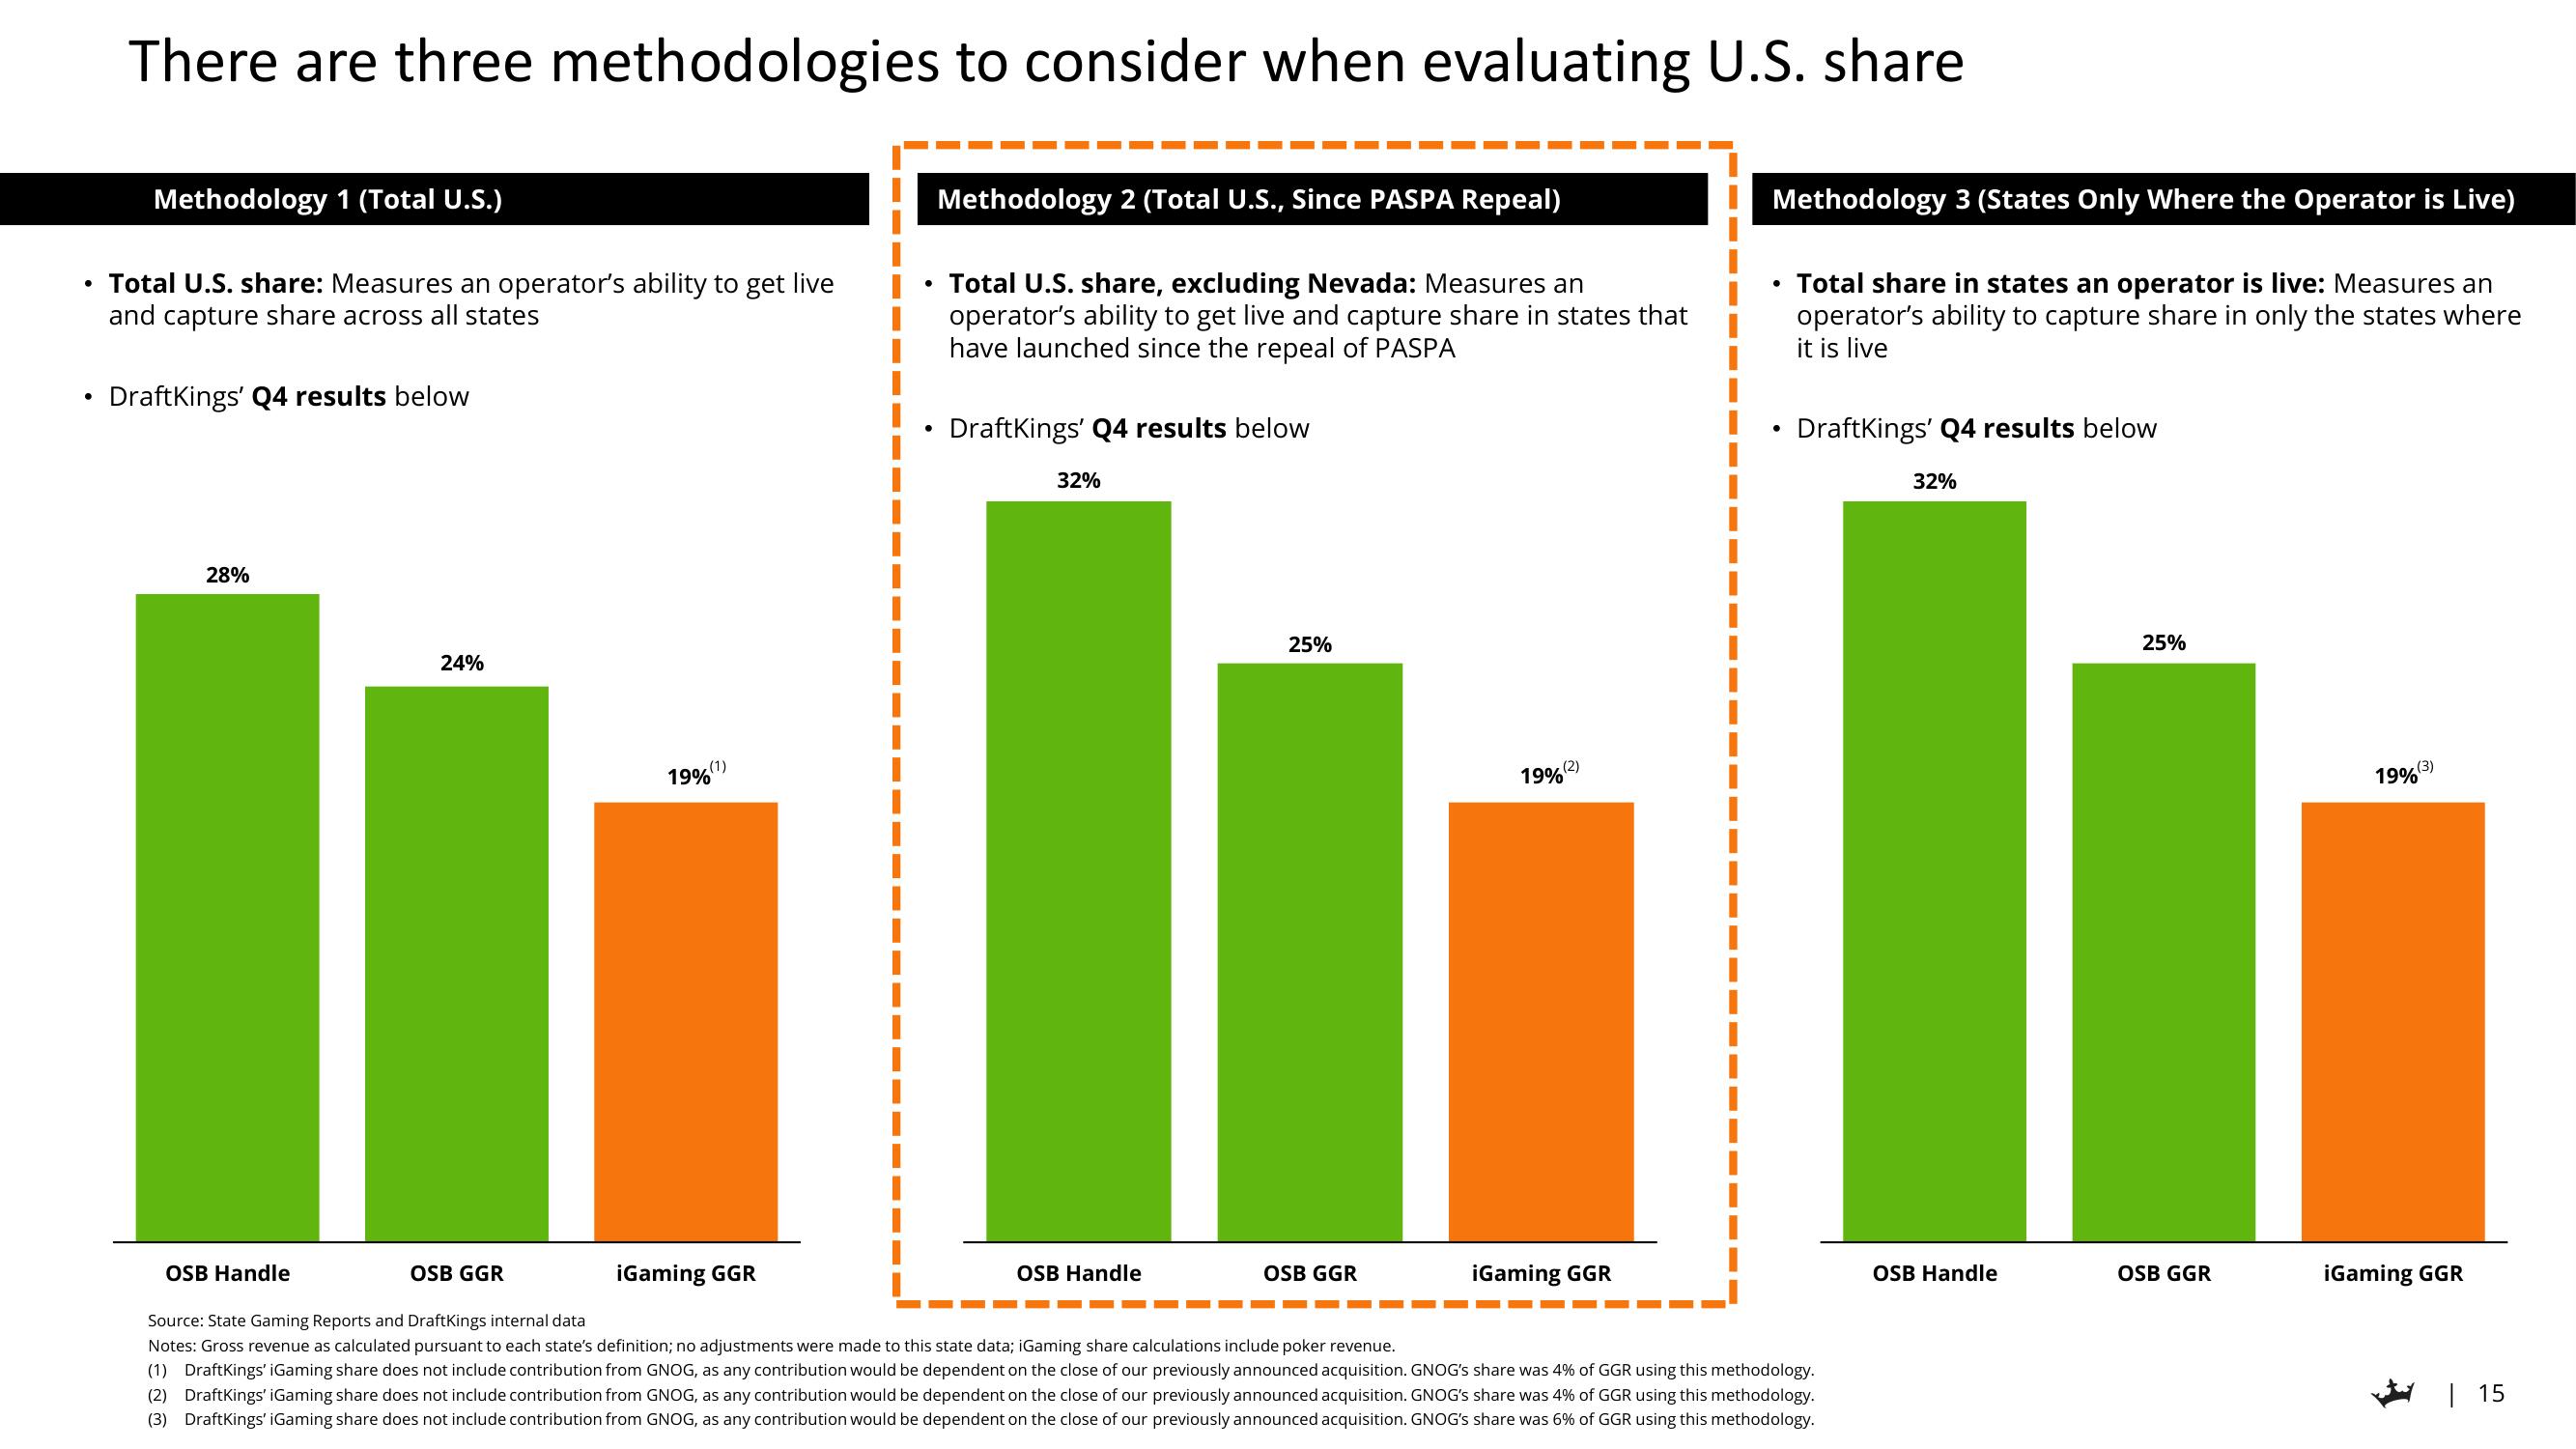
There are three methodologies to consider when evaluating U.S. share
Methodology 1 (Total U.S.)
Total U.S. share: Measures an operator's ability to get live
and capture share across all states
●
• DraftKings' Q4 results below
28%
24%
19% (1)
OSB GGR
iGaming GGR
Methodology 2 (Total U.S., Since PASPA Repeal)
• Total U.S. share, excluding Nevada: Measures an
operator's ability to get live and capture share in states that
have launched since the repeal of PASPA
DraftKings' Q4 results below
32%
OSB Handle
25%
19%
OSB GGR
(2)
OSB Handle
Source: State Gaming Reports and DraftKings internal data
Notes: Gross revenue as calculated pursuant to each state's definition; no adjustments were made to this state data; iGaming share calculations include poker revenue.
(1) DraftKings' iGaming share does not include contribution from GNOG, as any contribution would be dependent on the close of our previously announced acquisition. GNOG's share was 4% of GGR using this methodology.
(2) DraftKings' iGaming share does not include contribution from GNOG, as any contribution would be dependent on the close of our previously announced acquisition. GNOG's share was 4% of GGR using this methodology.
(3) DraftKings' iGaming share does not include contribution from GNOG, as any contribution would be dependent on the close of our previously announced acquisition. GNOG's share was 6% of GGR using this methodology.
Methodology 3 (States Only Where the Operator is Live)
iGaming GGR
●
Total share in states an operator is live: Measures an
operator's ability to capture share in only the states where
it is live
DraftKings' Q4 results below
32%
OSB Handle
25%
OSB GGR
19% (3)
¡Gaming GGR
| 15View entire presentation