Blackwells Capital Activist Presentation Deck
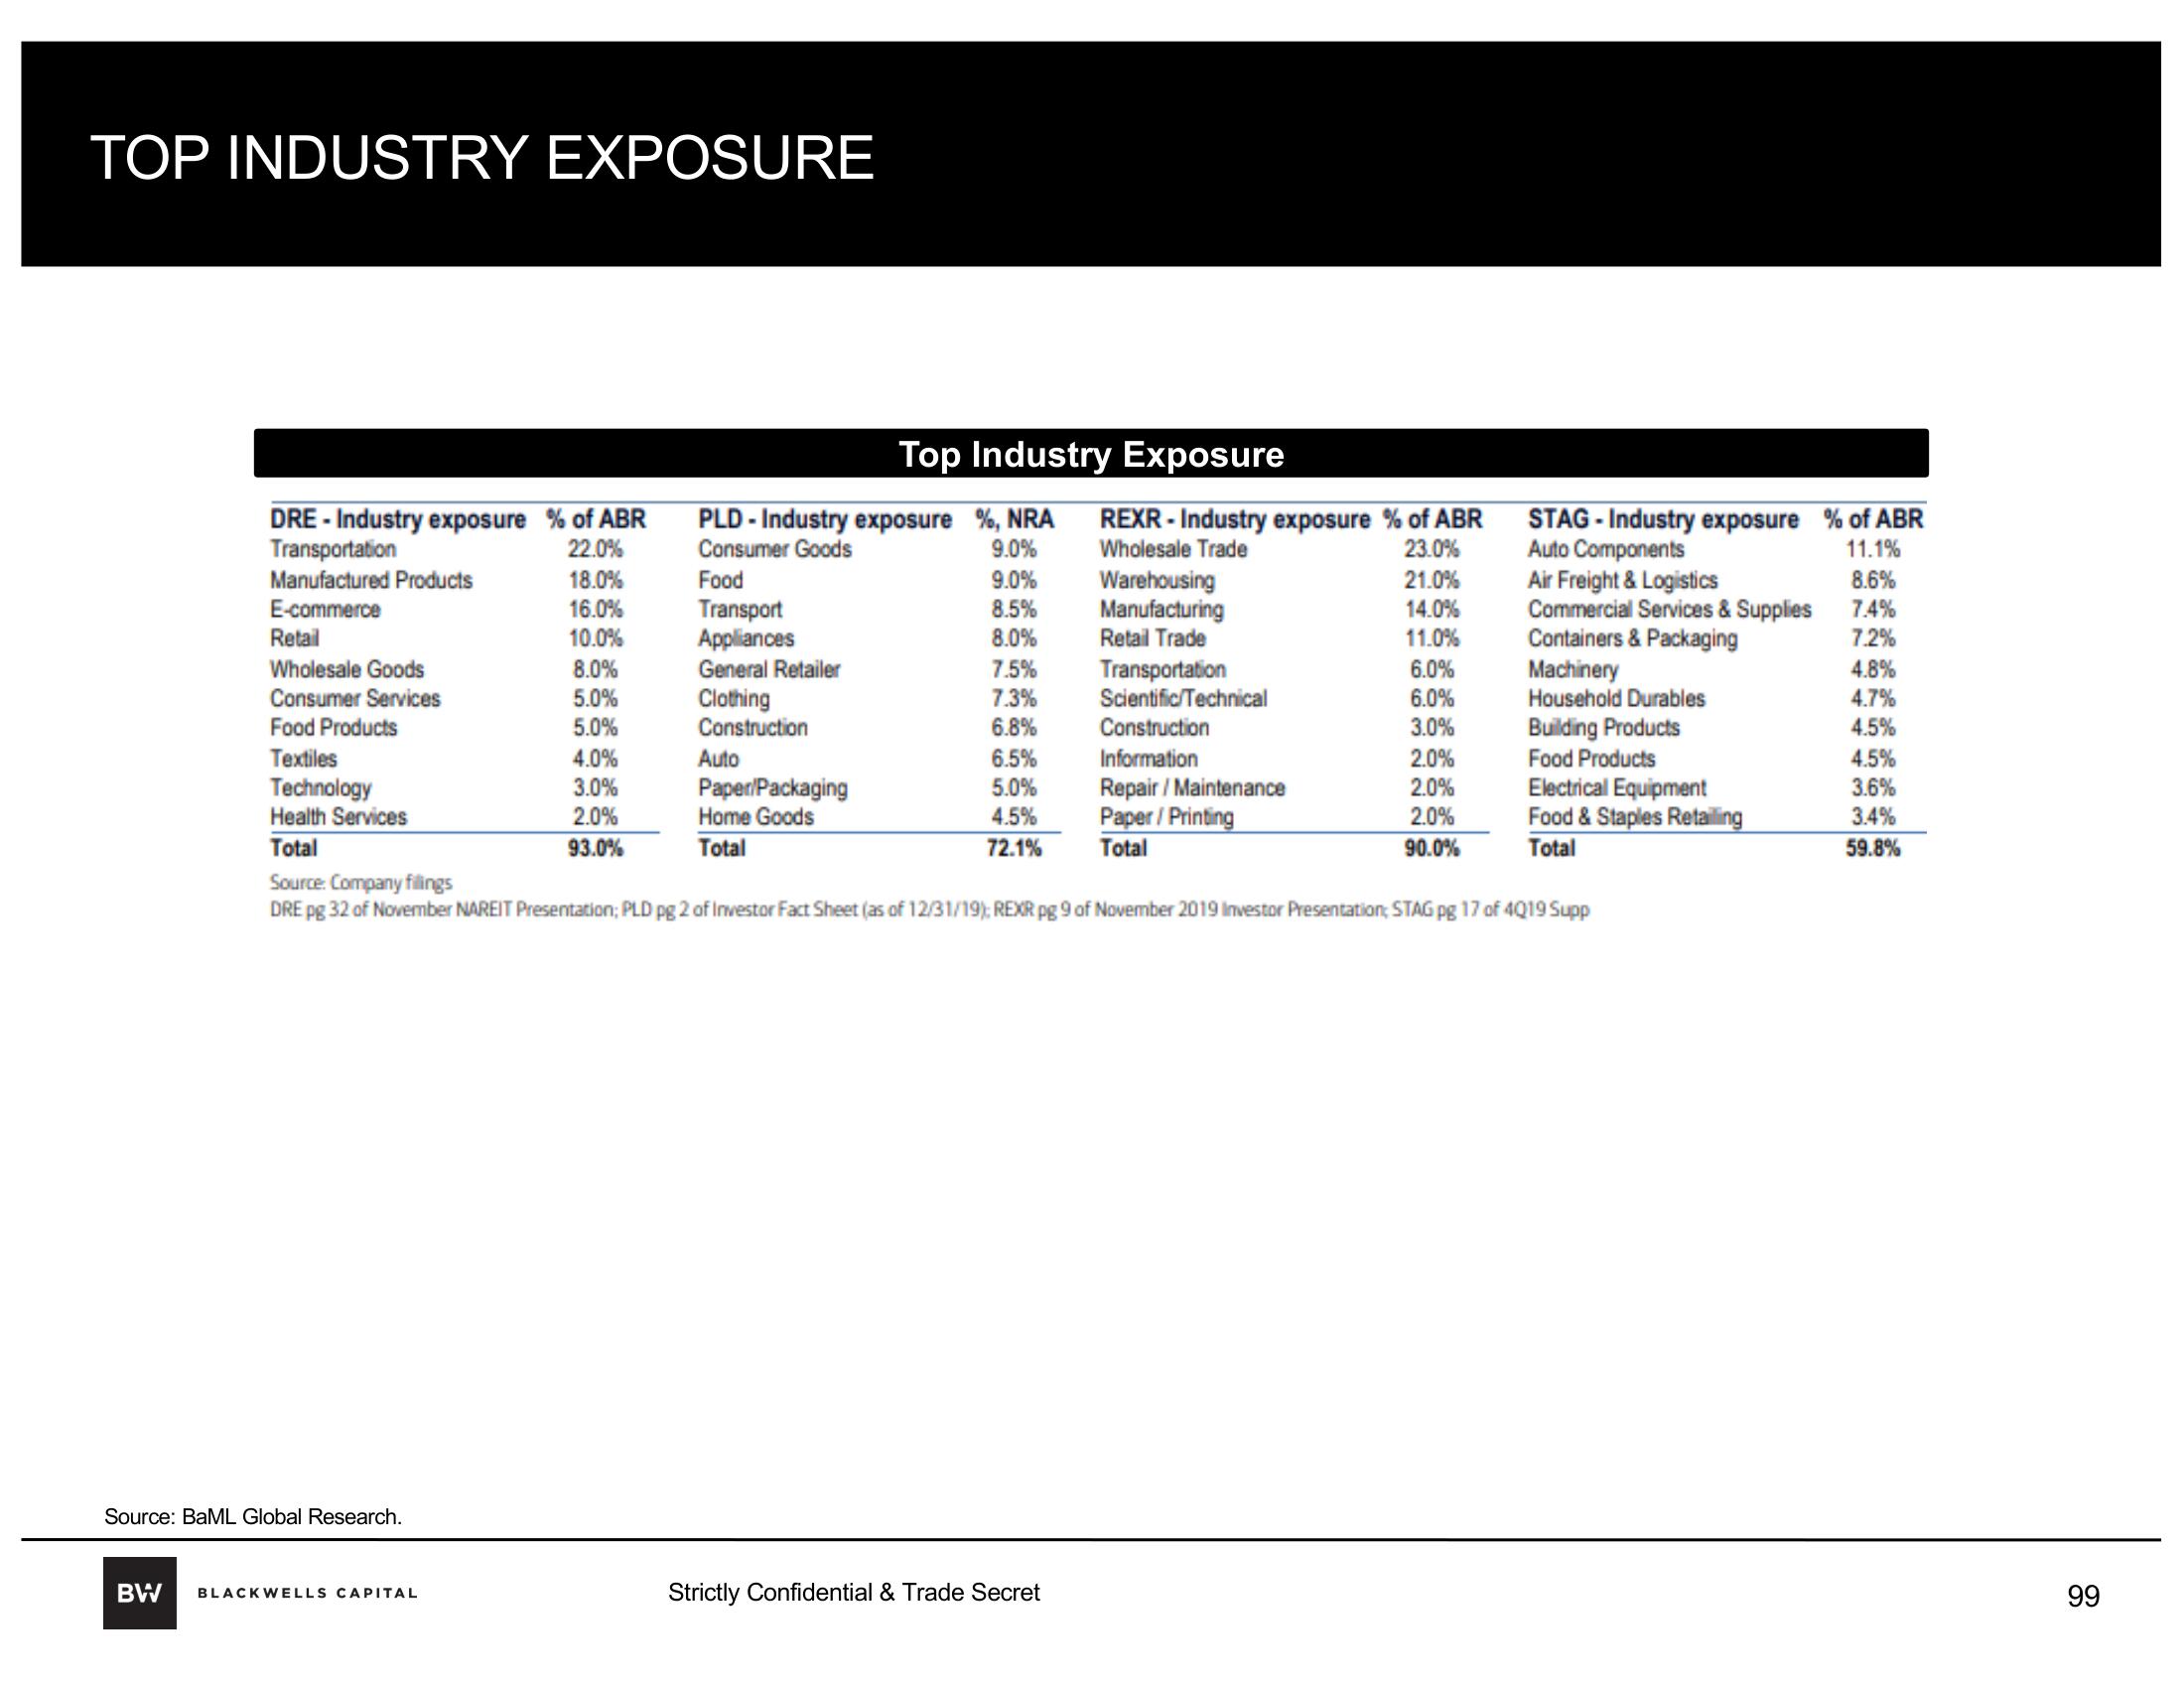
TOP INDUSTRY EXPOSURE
DRE - Industry exposure % of ABR
Transportation
22.0%
Manufactured Products
E-commerce
Retail
Wholesale Goods
Consumer Services
Food Products
Textiles
Technology
Health Services
Total
Source: BaML Global Research.
18.0%
16.0%
10.0%
BW BLACKWELLS CAPITAL
8.0%
5.0%
5.0%
4.0%
3.0%
2.0%
93.0%
PLD - Industry exposure %, NRA
Consumer Goods
9.0%
Food
Transport
Appliances
General Retailer
Clothing
Construction
Auto
Top Industry Exposure
Paper/Packaging
Home Goods
Total
9.0%
8.5%
8.0%
7.5%
7.3%
6.8%
6.5%
5.0%
4.5%
72.1%
REXR - Industry exposure % of ABR
Wholesale Trade
23.0%
Strictly Confidential & Trade Secret
Warehousing
Manufacturing
Retail Trade
Transportation
Scientific/Technical
Construction
Information
Repair/Maintenance
Paper / Printing
Total
21.0%
14.0%
11.0%
6.0%
6.0%
3.0%
2.0%
2.0%
2.0%
90.0%
Source: Company fillings
DRE pg 32 of November NAREIT Presentation; PLD pg 2 of Investor Fact Sheet (as of 12/31/19); REXR pg 9 of November 2019 Investor Presentation; STAG pg 17 of 4019 Supp
STAG - Industry exposure % of ABR
Auto Components
11.1%
8.6%
7.4%
7.2%
4.8%
4.7%
4.5%
4.5%
3.6%
3.4%
59.8%
Air Freight & Logistics
Commercial Services & Supplies
Containers & Packaging
Machinery
Household Durables
Building Products
Food Products
Electrical Equipment
Food & Staples Retailing
Total
99View entire presentation