Paysafe Results Presentation Deck
Q2 summary of consolidated results
$ in millions, except volume
Volume
Revenue
Gross Profit (excluding D&A)
Margin %
Adj. EBITDA
Margin %
Depreciation and amortization
Interest expense, net
Net income (loss) attributable to Paysafe
Paysafe:
Q2'20(¹)
Q2¹21
$22.7bn $32.3bn
$341.0
$214.8
63.0%
$110.4
32.4%
$67.5
$42.5
($15.9)
$384.3
$228.6
59.5%
$118.8
30.9%
$70.1
$62.7
$6.6
Change
41%
13%
6%
8%
4%
47%
NM
●
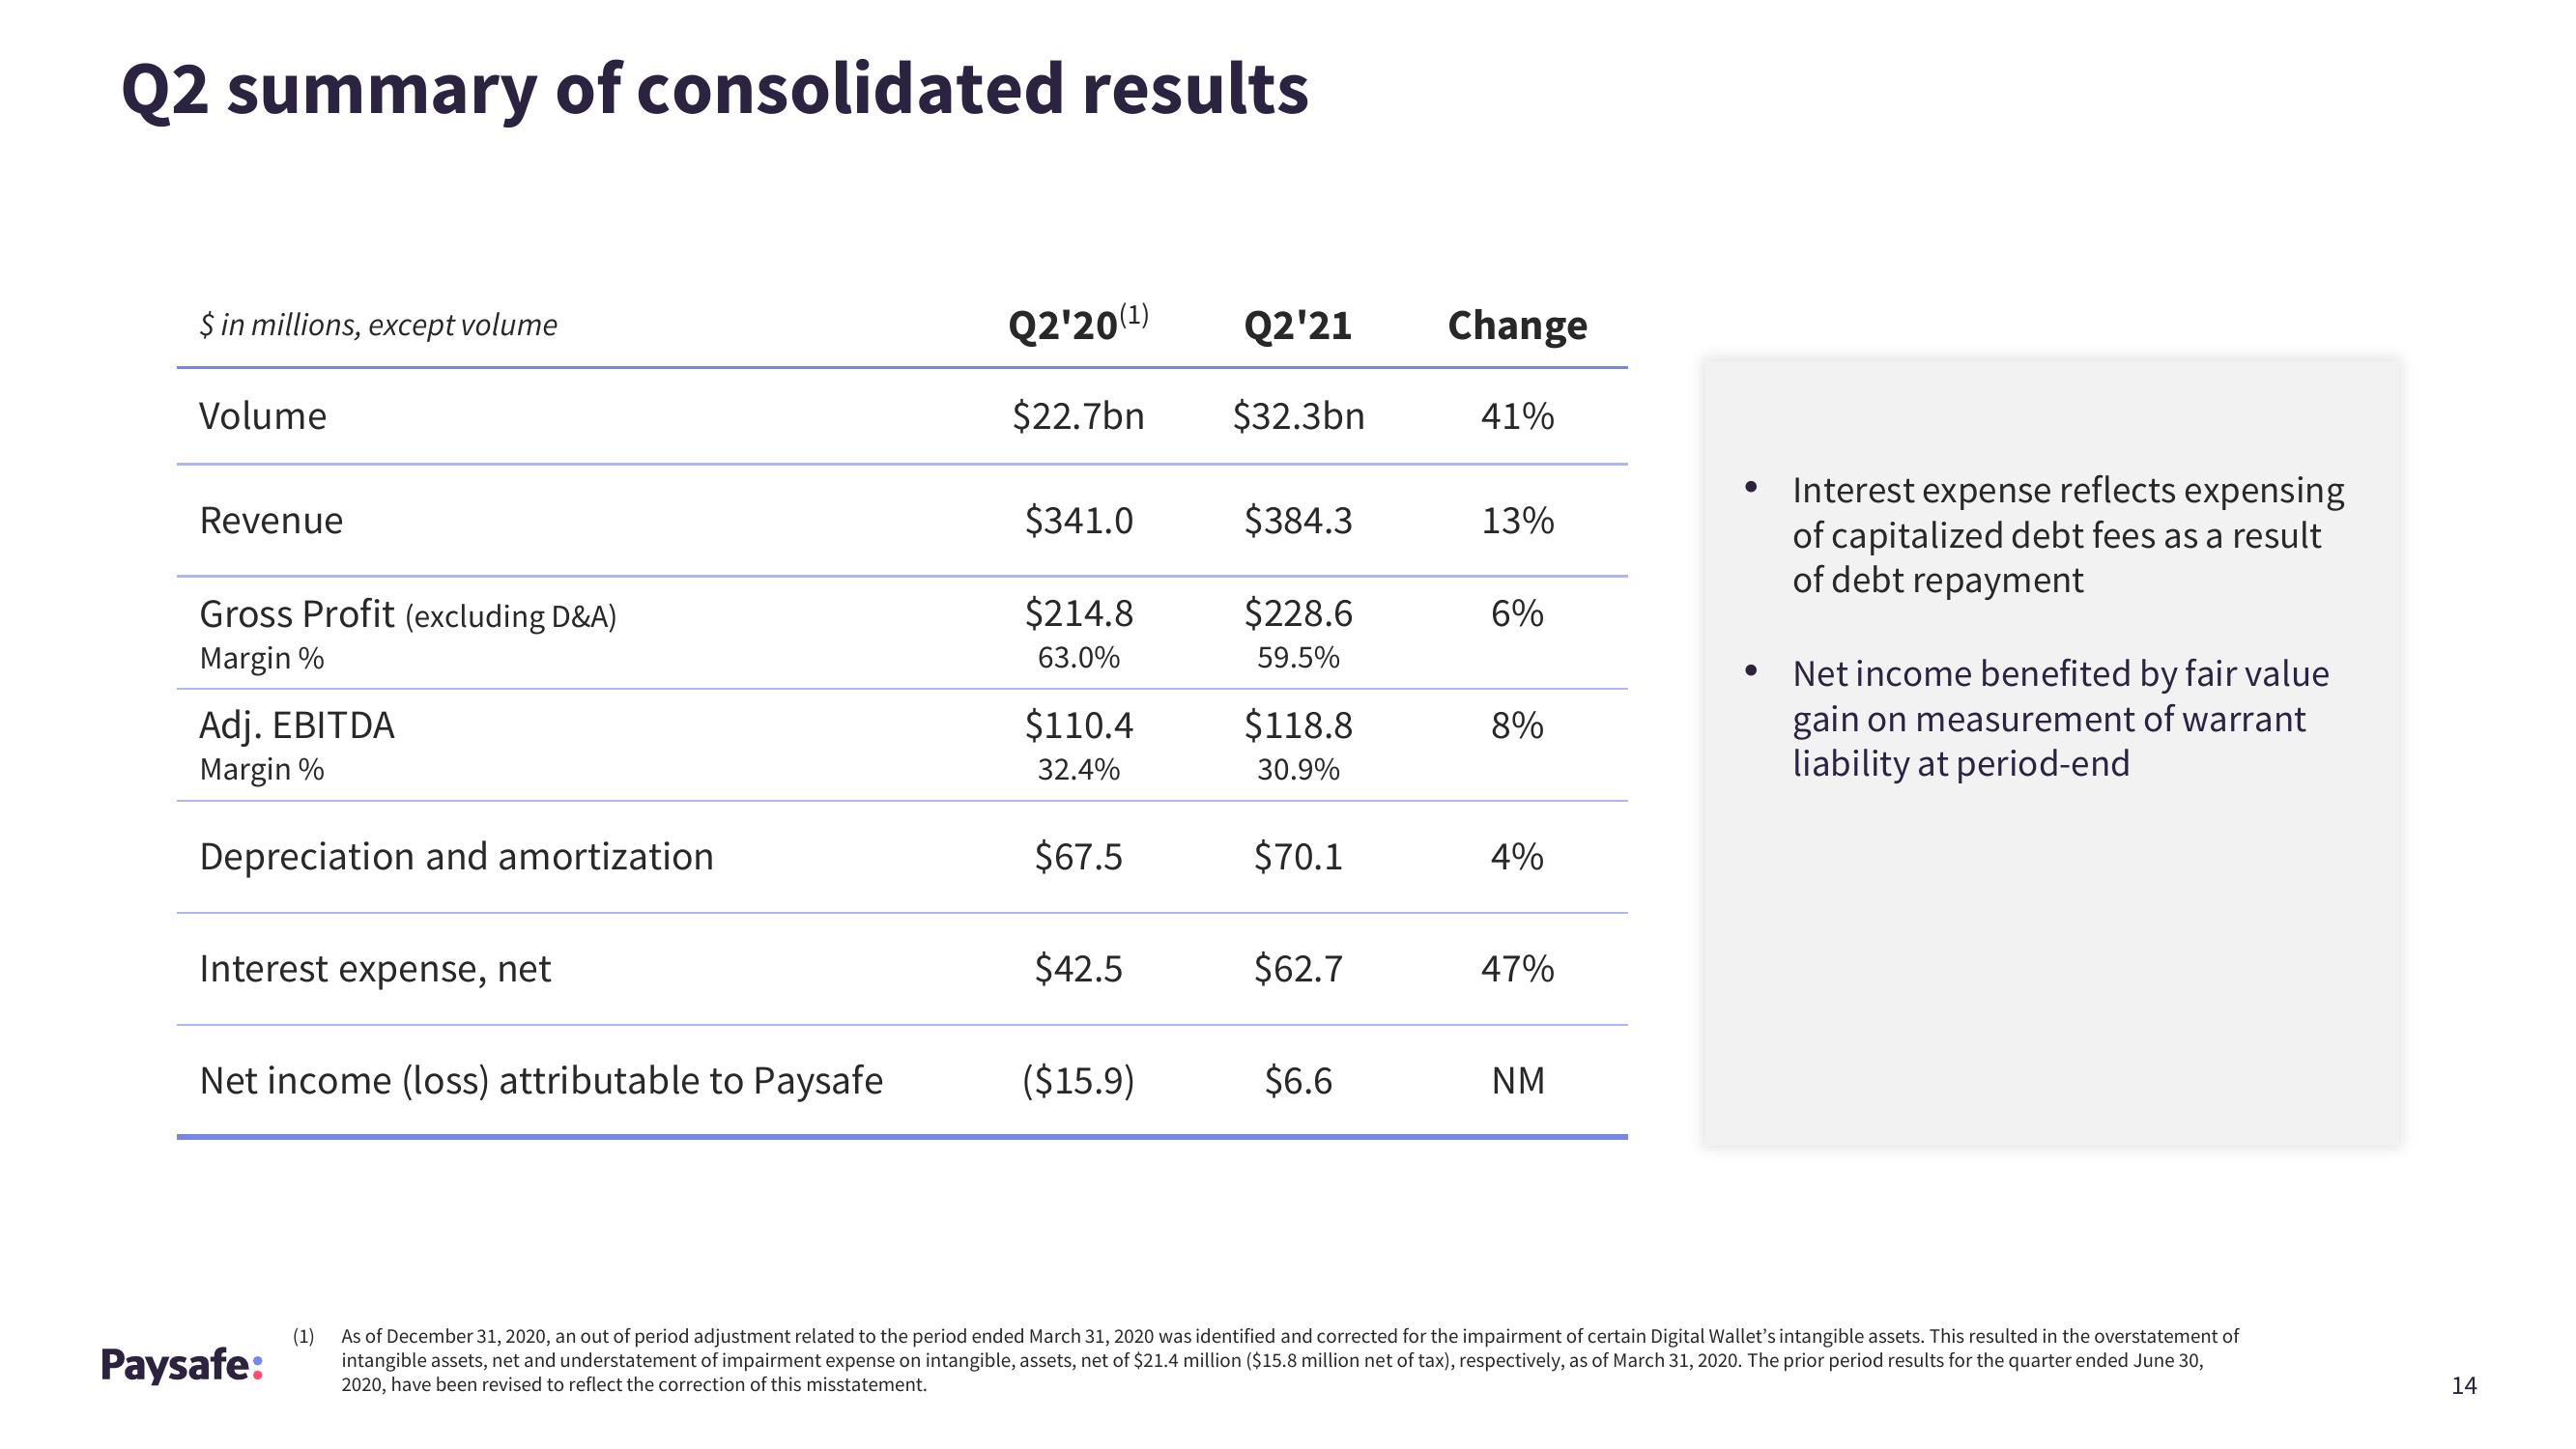
Interest expense reflects expensing
of capitalized debt fees as a result
of debt repayment
Net income benefited by fair value
gain on measurement of warrant
liability at period-end
(1) As of December 31, 2020, an out of period adjustment related to the period ended March 31, 2020 was identified and corrected for the impairment of certain Digital Wallet's intangible assets. This resulted in the overstatement of
intangible assets, net and understatement of impairment expense on intangible, assets, net of $21.4 million ($15.8 million net of tax), respectively, as of March 31, 2020. The prior period results for the quarter ended June 30,
2020, have been revised to reflect the correction of this misstatement.
14View entire presentation