Nexters SPAC Presentation Deck
Key financial highlights
(A)
Bookings (¹)
$m
110
Q2 2020
208
+40%
+29%
154
Q2 2021
268
H1 2021
(B)
Adjusted costs and expenses (2)
$m
67
Q2 2020
143
H1 2020
+106%
+68%
139
Q2 2021
240
H1 2021
Selling and Marketing Costs
$m
31
Q2 2020
73
HT 2020
+193%
+112%
91
Q2 2021
HT 2020
Management profitability measure = (A) - (B)
Source: Company information
1) The Company defines Bookings as sales contracts generated from in-game purchases and advertising in a given period
Reflects corrections to the amounts reported in the Company's previous filings with the SEC due to the identification of an immaterial error relating to the calculation of withholding taxes in 2020 and other insignificant
adjustments identified in the course of the financial reporting closing process as of June 30, 2021. For further information, see Note 4 (Use of judgements and estimates-Immaterial error) to the Company's interim
condensed consolidated financial statements for the six months ended June 30, 2021 as filed with the SEC on September 22, 2021
28 2) The Company defines Adjusted costs and expenses as the total of platform commissions, game operating costs, selling and marketing expenses and general and administrative expenses for the period as shown in the
Company's financial statements in accordance with IFRS, adjusted to exclude (i) share-based compensation expense, (ii) net change in deferred platform commission fees, (iii) impairment of non-current assets, (iv) any gains
and losses arising as result of business combinations and (v) other special items, which are infrequent in nature and/or outside of the normal operating business. Adjusted costs and expenses is a non-IFRS financial measure
and should not be construed as an alternative to total comprehensive profit/loss for the year as an indicator of operating performance as determined in accordance with IFRS.
155
H1 2021
nexters
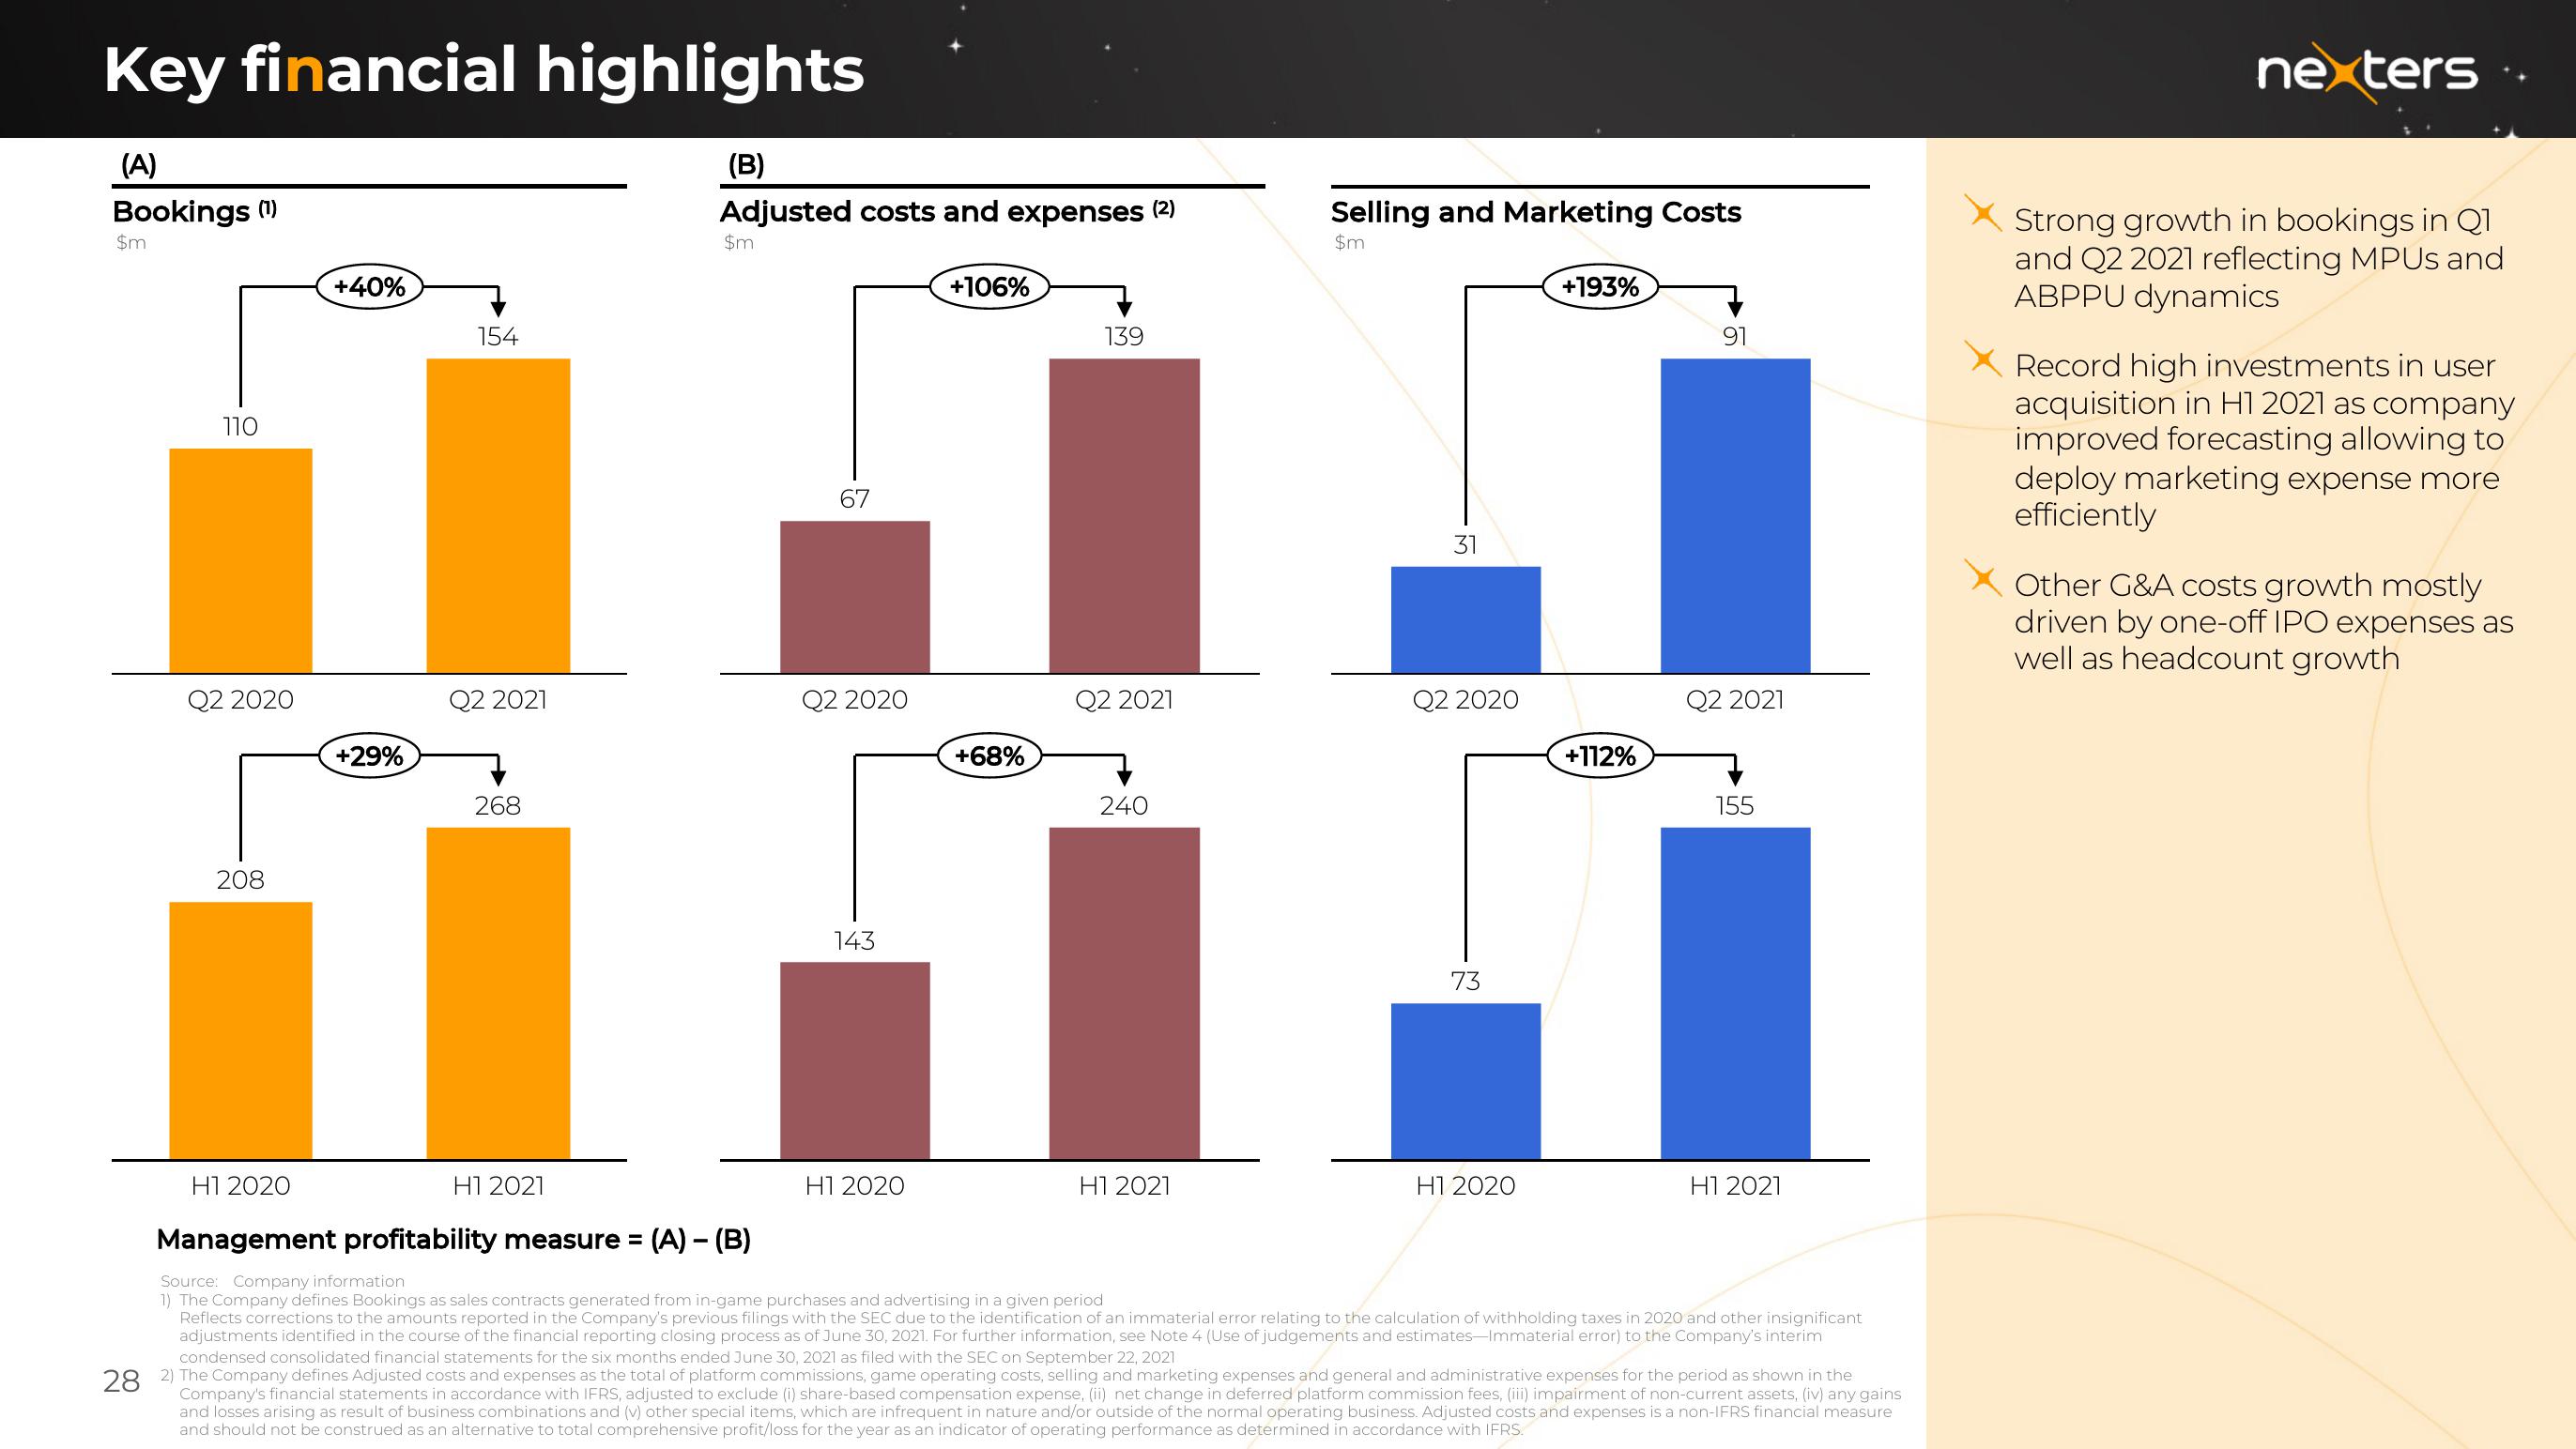
Strong growth in bookings in Q1
and Q2 2021 reflecting MPUs and
ABPPU dynamics
XRecord high investments in user
acquisition in H1 2021 as company
improved forecasting allowing to
deploy marketing expense more
efficiently
Other G&A costs growth mostly
driven by one-off IPO expenses as
well as headcount growthView entire presentation